Motor Current Signature Analysis (MCSA) Applications
Motor Diagnostic technologies have become even more prevalent through the 1990’s and into the new century. The technologies include both Motor Circuit Analysis (MCA) and Motor Current Signature Analysis (MCSA) applied to both energized and de-energized electric motor systems. The applications appear to be almost endless.
The systems included in this paper are the ALLTEST IV PRO 2000 motor circuit analyzer, the ALL-TEST PRO OL motor current signature analyzer, EMCAT motor management software, Power System Manager software, and ATPOL MCSA software. The ALL-TEST PRO MD kit includes the integration of all of these systems in addition to the US Department of Energy’s MotorMaster Plus software. The purpose of this paper is to emphasis the MCSA application of the ALL-TEST PRO MD system which maintains the following:
- MCA readings of resistance, impedance, inductance, phase angle, current/ frequency response and insulation to ground (MegOhm) testing.
- MCSA capabilities of voltage and current demodulation, including FFT analysis to 5 kHz.
- Automated analysis and trending capabilities for both MCA and MCSA through software.
- Full Power Quality datalogging and analysis including instantaneous three phase event capture.
The examples found within this paper include many of the potential applications available through the implementation of Motor Diagnostic technologies.
Rotor Bar Testing
The fundamental purpose behind the original development of MCSA technology was the detection of rotor bar faults. Rotor bars are difficult to assess using traditional test methods, including vibration analysis. It was determined that a method using current could be used to evaluate the condition of the rotor bars. The basic rule is simple: Pole pass frequency sidebands around the fundamental line frequency, when the motor is under load, indicate problems with the rotor. The standard rule has been determined that rotor bar issues are serious when the sideband peaks approach to within 35 dB of the line frequency peak..
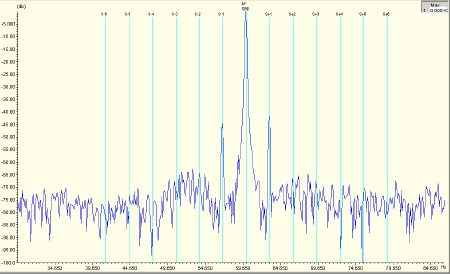
Figure 1: Rotor Bar Frequencies
The example in Figure 1 shows sidebands at about -40 dB from the peak line frequency. This would indicate at least one fractured rotor bar in this 500 HP, 4160 Volt motor on a compressor.
Figure 2 is an example of one of two possible
scenarios:
- Casting voids in an aluminum rotor.
- Soft tooth (or teeth) in a geared application.
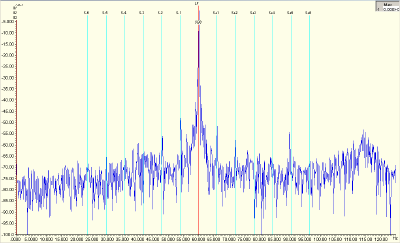
Figure 2: Casting Void or ‘Soft’ Gear Tooth
Using higher frequency demodulated voltage and current FFT’s, issues such as dynamic and static eccentricity, loose rotor bars and other rotor-related faults can be detected.
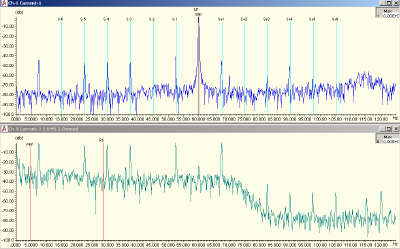
Figure 3: Rotor Rub at No Load
The data in Figure 3 relates to a 7.5 horsepower, 1800 RPM, submersible pump tested dry at no load. The rotor was rubbing slightly against the stator core which was identified as static and dynamic eccentricity with multiple current peaks as shown.
Induction Motor Testing
Single and three phase motors can be evaluated using a combination of demodulated voltage and current. One particular rule, and strength, of a
combination of voltage and current, is that if the peaks show in voltage and current, the fault is electrical in nature, if the peak shows in current, but not voltage then the problem is mechanical in nature. One other advantage to evaluating systems with MCSA is that you can detect power supply and load-related faults.
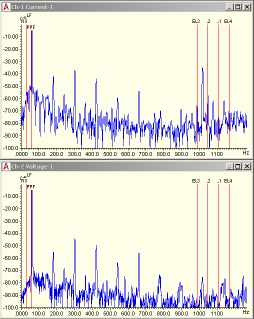
Figure 4: Stator Mechanical Fault
As you will note in Figure 4, peaks are identified in current, but do not show in the voltage FFT. This indicates that mechanical faults exist. As they relate to the running speed and the number of stator slots, it is a mechanical fault related to the windings. Several other current-only peaks exist, indicating load-related faults, in this case, most likely a gearbox problem (note that this is the high-frequency data related to Figure 2).
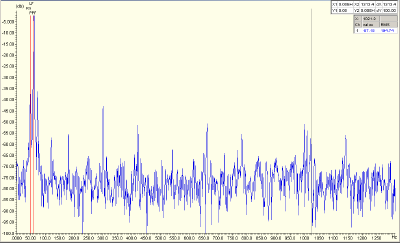
Figure 5: Mechanical Unbalance
The motor shown in Figure 5 had a mechanical unbalance. The signature shows up as a twice line frequency (LF), four times line frequency then twice line frequency pattern. In this case, rotor bars times running speed with LF sidebands then the remaining pattern appears.
DC Motor Testing
DC motors are evaluated in a similar way as vibration. As a matter of fact, the signatures are the same in vibration as in MCSA. The DC voltage and current are taken from the armature circuit.
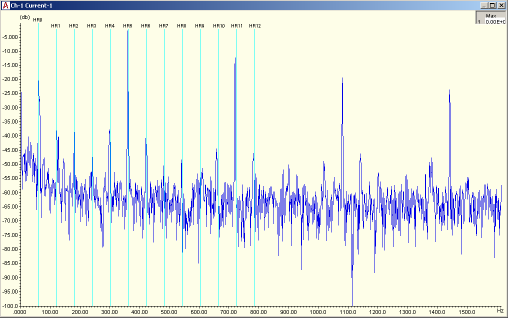
Figure 6: DC Drive Fault
In the case of Figure 6, multiple harmonics of line frequency plus multiple harmonics of the number of power electronics (SCR’s) times line frequency (360 Hz, in this case), indicates an SCR fault or loose connection. This can be confirmed by viewing the voltage and frequency ripple in the low frequency data.
Synchronous Alternator Testing
Synchronous alternators can also be evaluated quickly and simply using voltage and current demodulated current. In the case of the following example, an alternator tripped on high temperature. Both MCA and MCSA were used to evaluate the system.
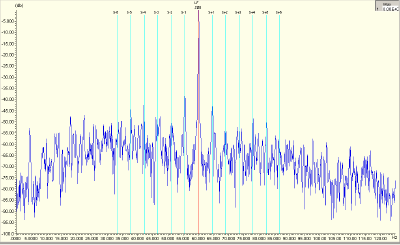
Figure 7: MCSA Data on Synchronous Alternator (Low Freq)
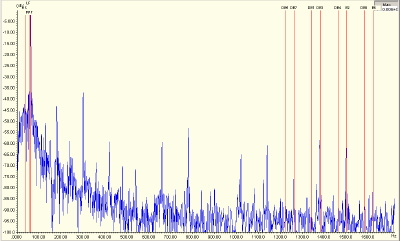
Figure 8: Alternator Dynamic Eccentricity
The alternator being tested showed an increase to eccentricity over a 40 minute test run, rotatingfield faults and some electrical fault signatures. This information was coupled with MCA data which indicated a winding short, a cable short and a significant drop in insulation resistance over the short part-load run. The alternator was a 475 kW, 480 Vac alternator which required three parallel cables per phase. There are a number of options with the ATPOL system for larger cables. However, in a pinch, one of each of the three cables of each phase was used, so the current values were roughly 1/3rd.
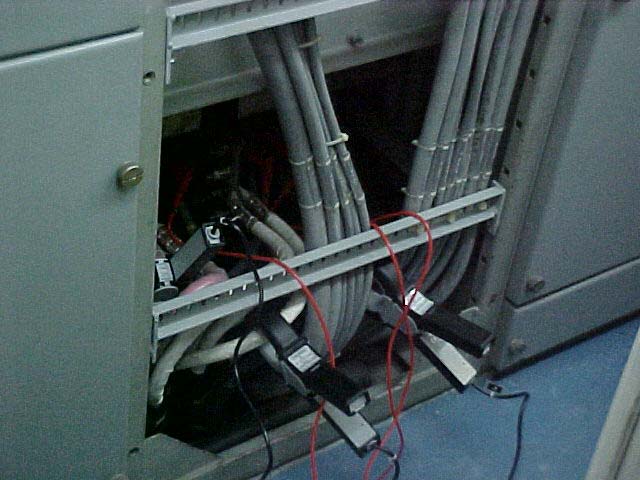
Figure 9: Current Connection for Alternator
Variable Frequency Drives
Variable frequency drives have been a challenge for a number of MCSA systems. In the case of the ATPOL, however, this is not a problem. The output voltage and current signals can be viewed (Figure 10).
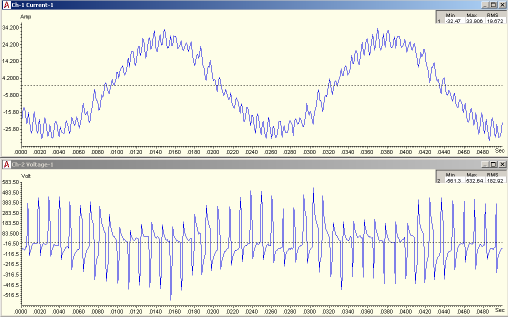
Figure 10: VFD Voltage and Current Waveforms (0.05 Second Capture)
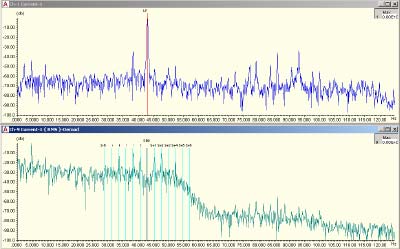
Figure 11: VFD Low Frequency Data
In Figure 11, which is the Low Frequency (<120 Hz) data for the same system as Figure 10, shows that the output line frequency of the drive is 43 Hz and the operating speed of the 3600 RPM motor is 2570 RPM.
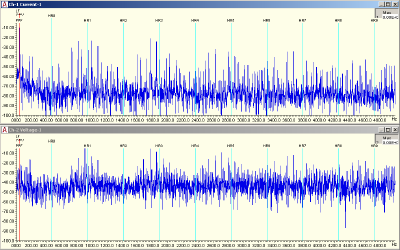
Figure 12: VFD High Frequency Data
As can be noted in Figure 12, strong voltage and current peaks indicate motor system related faults. Some of the additional noise is strictly due to the voltage and current waveforms that come from the VFD. However, the software will automatically place cursors related to different faults within the waveforms.
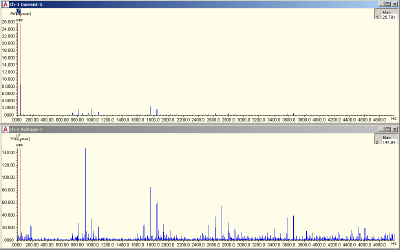
Figure 13: Special Analysis in Peak Values
Figure 13 shows the same data, but with the peak voltages and currents shown. The higher frequency currents indicate issues related to the voltage harmonics, which are shown in the lower waveform. All data combined shows an incoming voltage related issue. When tested at 46 Hz, the problem became more significant and pointed to a potential fault with the supply system that becomes prevalent above 45 Hz.
The solution would be alleviated with filtering applied to the VFD drive output.
Punch Press with Motor and Eddy-Current Drive
The complete motor system can be viewed, including the driven load.
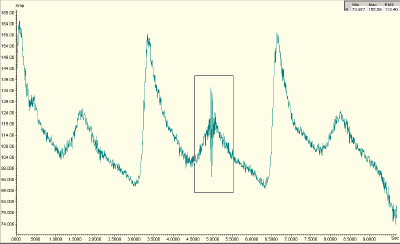
Figure 14: Punch Press Load Cycle
Figure 14 shows the current cycle over 10 seconds. Peak A is one of three peaks in this cycle that relates to the punch (bottom) of the press stroke while point C is related to the top of the stroke. Point B identifies some type of rubbing or grabbing problem as the system approached the peak of the stroke. The three bottom strokes help identify that the operation is occurring 18 times per minute.
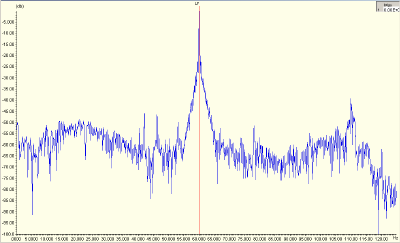
Figure 15: Motor-Related Line Frequency Sidebands
Figure 15 identifies a high ‘noise floor’ and many sidebands around the peak LF frequency. This, along with the high frequency data, assists in pointing the direction towards the load.
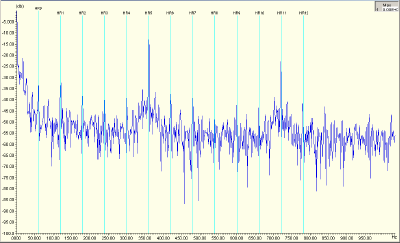
Figure 16: Eddy-Current Clutch High Frequency Data
Figure 16 identifies that a connection and/or SCR fault exists in the supply DC voltage from the rectifier (six SCR’s). The peaks in the high
frequency spectrum also identify faults in the eddy-current drive and the punch press itself, most likely looseness in the system (related signatures show raised noise floors).
MCSA and Energy Applications
The automated reporting and data-logging features of the ATPOL system also include the ability to work along with the US Department of Energy’s MotorMaster Plus software.
Additional features were funded for inclusion into MotorMaster Plus by ALL-TEST Pro, Dreisilker Electric Motors and Pruftechnik to allow for motor diagnostic information to be included for analysis. The use of both MCA and MCSA allow the user to evaluate the condition of an electric motor then make an energy-related repair versus replace decision with a confirmable return on investment.
For instance, a 40 horsepower, 1800 RPM motor tested with MCSA determined some mechanical and electrical related faults. The data was incorporated into a MotorMaster Plus report and the operating frequency was determined as 91.5% efficient at 90% load. Assuming an energy cost of $0.07/kWh and $14/kW demand, with 2000 (1 shift) operating per year, a replacement premium efficient electric motor was identified with a 0.9 year simple payback and 866% after tax return on investment.
Data can also be utilized by the US Department of Energy’s Pump System Assessment Tool (PSAT), AirMaster and other tools.
Motor Diagnostic Power – ALL-TEST PRO MD System
The combined power of MCA and MCSA available in the ALL-TEST PRO MD kit, integrated through the EMCAT Motor Management Software system, allows for the
user to perform the following:
- Automated analysis of both MCA and MCSA data.
- Payback calculation through the Power System Manager and MotorMaster Plus software systems.
- Commissioning of electrical machinery
- Troubleshooting of electrical machinery
- Trending of electrical machinery
- Root-Cause-Analysis of electrical machinery
- Complete system view of the electrical and mechanical health
- Evaluation of AC/DC systems, loads through ‘soft coupling’ systems (ie: eddy-current drives)
- Energy studies and surveys.
- Supports other diagnostic technologies such as vibration, infrared and more.
All through a simple motor diagnostic system. Data can be collected using the hand-held data collectors or through the ‘remote-operation’ capability via a computer or laptop (system can be operated remotely from a computer screen).
Conclusion
The purpose of this ALL-TEST Pro white paper was to present the MCSA capabilities of the ALL-TEST PRO MD motor diagnostic system.
The capabilities, as demonstrated, go well beyond the simple analysis of induction motors and include:
- AC Motors and Alternators
- DC Motors and Generators
- Single and Three phase systems
- Eddy-Current drives
- Variable Frequency Drives
- Incoming power quality
- Driven load
- Much more
The capabilities have gone far beyond those cited in this paper.
Additional papers will be presented that identify opportunities using power quality, MCA, MCSA and load-related fault detection.
AT34™
Analyze and trend motor component integrity for ground faults, internal winding faults, open connections, and contamination – all with one hand-held device.

Motor Diagnostic Seminar at the University of Tennessee Reliability Center – Level 1 & Level 2 – July 22
The University of Tennessee Reliability Center and ALL-TEST Pro have teamed up to publicly present Motor Diagnostic Seminar Level I and Level II training courses this summer! This is a […]

Online World Class Motor Diagnostic Seminar – Level 1 – April 15-19
Have you heard? We will be holding our World Class Motor Diagnostic Seminar Level 1 on April 15-19. This will be an online/virtual seminar starting each day at 8AM EST. […]