ESAによる電気機械信頼性の向上
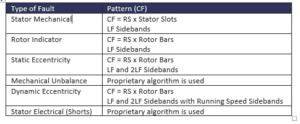
Figure 1. Typical motor faults (CF = center frequency, RS = running speed, LF = line frequency)
Electrical Characteristics Analysis (ESA ) is a predictive maintenance (PdM) technique that uses motor supply voltage and operating current to identify existing and developing faults throughout the motor system. These measurements act as transducers, and any faults in the motor system cause the motor supply current to fluctuate (or modulate). Analyzing these modulations can identify the source of the motor system disruption. Current-carrying motor testing using ESA provides valuable information for AC induction motors, DC motors, generators, wound rotor motors, synchronous motors, and machine tool motors, used for PdM testing, commissioning, and troubleshooting.
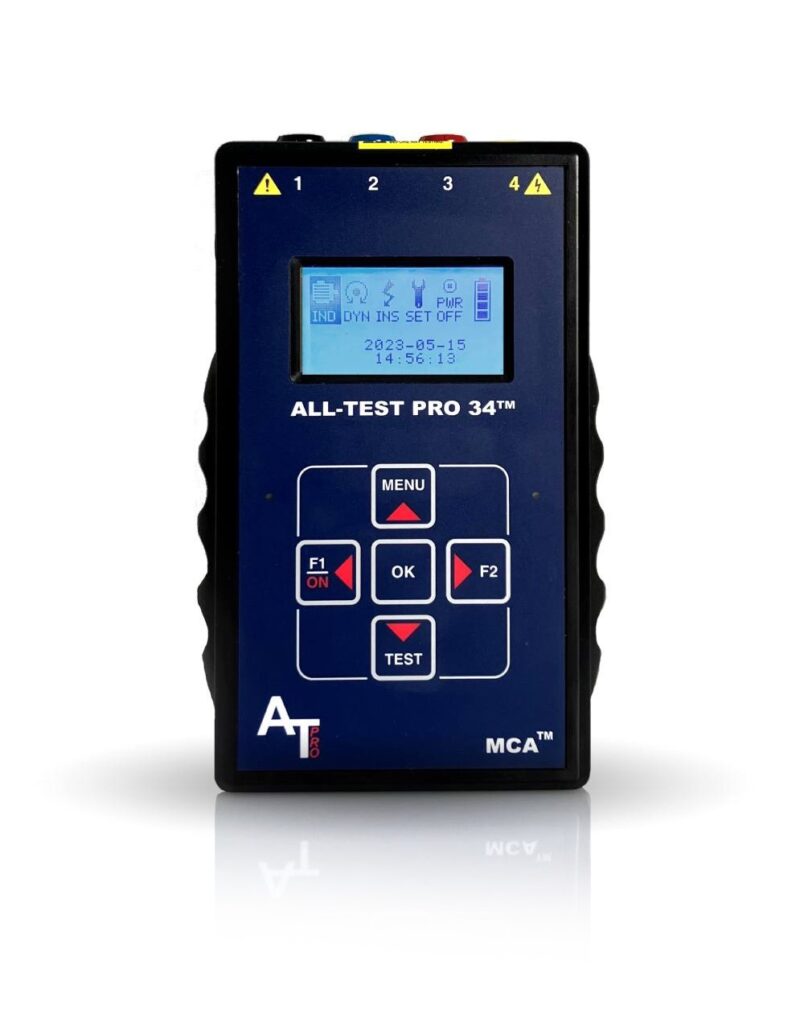
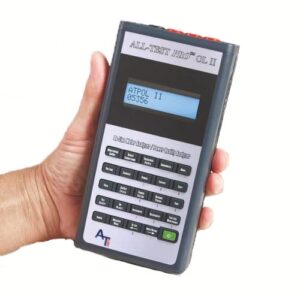
The portable, handheld, battery-powered ESA instrument ALL-TEST PRO On-Line II™ (ATPOL II™) collects current and voltage waveforms and performs Fast Fourier analysis, enabling engineers to assess the electrical and mechanical condition of motor systems.
Faults in a motor system (whether related to input power, motor electrical, mechanical, mechanical coupling, or the driven load) will all have unique signatures when using ESA techniques (see Figure 1). Therefore, with information about the motor and motor system, the associated failure frequencies can be identified and the entire system can be evaluated.
Numerous performance indications are revealed in the time and frequency domains that provide the information needed to determine the “health” of the motor and the effects of loading, allowing you to actually “see” true road speed, motor slip frequency, gear mesh frequency, drivetrain components and gear rotational speed.
A Fast Fourier Transform (FFT) is used to create both high- and low-frequency spectra. The peaks in these spectra correspond to the rotational speeds of various components of the machine. For example, for a fan driven by an electric motor via a belt, peaks correspond to the motor RPM, pole passing frequency, fan RPM, and belt RPM. If a gearbox is used instead of a belt drive, peaks in the spectrum appear at the gear rotational speed and gear meshing frequency.
Performing electrical signal analysis
While nameplate data is not required for the data collection process, automatic analysis can be performed by entering the motor’s nameplate voltage, operating speed, rated power, and full-load current in the analysis process. Common mechanical system failures between the motor and load due to wear and application include belt or direct drive misalignment, belt or insert wear, belt tension issues, and sheave wear. Depending on the type of load, numerous types of failures can occur. The most common are worn parts (e.g., seals), broken parts (e.g., gears, fan, and impeller blades), and bearings.
In ESA software, engineers input information about the mechanical system (see Figure 2), and the relevant frequencies are automatically calculated (the software provides cursors to identify these frequencies in the spectrum). Drive analysis includes belt, gear, and blade types. Note that the electrical and mechanical analysis of the motor does not require mechanical system information, and is only relevant if mechanical loads need to be analyzed.
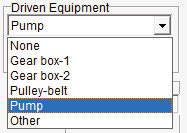
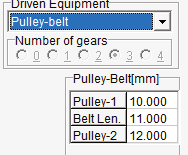
Figure 2. Electrical signal analysis software automates calculations and provides frequency cursors.
As an example, let’s look at the low-frequency data for Dust Collector Fan 1, which is driven by a 150-kilowatt, 400-volt, 260-amp, 1485-rpm induction motor (see Figure 3). Note the peak labeled BLT. This is the belt frequency, or belt speed. There are multiples of BLT, which are shown in both spectra. The lower spectrum shows a line-frequency peak and sidebands at the BLT frequency on either side of the line frequency. The presence of the belt frequency at 4.3 amps is particularly significant. The sidebands are significant because they are present. They are also many times the belt frequency. Therefore, I suspect there may be a problem with this collector. However, the technician who collected this data and performed the initial analysis chose to monitor this machine rather than conduct further inspections or tests.
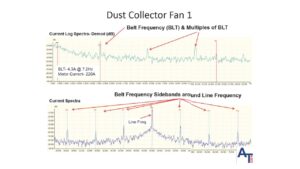
Figure 3. This dust collection fan is powered by a 150 kilowatt, 400 volt, 260 amp, 1485 RPM induction motor.
A sister machine, Dust Collector Fan 2, was also tested. Notice in Figure 4 that the BLT peaks at 8.3A, even though the motor load is lower than Fan 1 (194A vs. 220A). From this initial test, we cannot conclude that this is a serious problem, but instead it is a warning flag that something is different about this machine compared to the first.
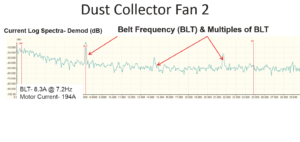
Figure 4. Dust collector fan test results 2.
As this data was acquired during the detection phase of the PdM work process, the next step will be the analysis phase. As part of the analysis phase, technicians performed a quick visual inspection of both spacecraft and noted excessive belt movement on Fan 2 compared to Fan 1. The next step will be for ESA to acquire additional data and carry out further work, such as deploying other instruments as part of the analysis phase.
conclusion
Electric motors are excellent transducers when using electrical signal analysis because they can assess input power, the electrical and mechanical condition of the motor, and the driven load. Power quality, controls, stator and rotor condition, air gaps, bearings, alignment, and loads can be analyzed to detect impending failures and identify trends for predictive maintenance purposes.
This application story is the first of a three-part series on the use of ESA to assess the condition of motor-driven mechanical systems.
For more information, visit www.alltestpro.com.
About ALL-TEST Pro, LLC
ALL-TEST Pro delivers true motor maintenance and troubleshooting with innovative diagnostic tools, software and support.