ปรับปรุงความน่าเชื่อถือทางกลไฟฟ้าโดยใช้ ESA
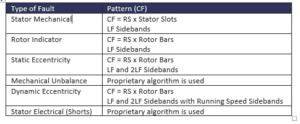
Figure 1. Typical motor malfunctions (CF = Center Frequency, RS = Operating Speed, LF = Line Frequency).
Electrical Signature Analysis (ESA) is a predictive maintenance (PdM) technology that uses motor supply voltage and motor operating current to identify existing and developing faults in the entire motor system. These measurements act as transducers, and any disruptions in the motor system cause changes (or modulation) in the motor supply current. By analyzing these modulations, you can identify the sources of these motor system disruptions. Powered motor testing using ESA provides valuable information for AC and DC induction motors, generators, wound rotor motors, synchronous motors, and machine tool motors for PdM testing, operational testing, and troubleshooting.
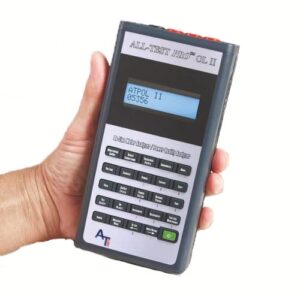
Current and voltage waveforms are collected using the battery-powered, handheld ESA instrument ALL-TEST PRO On-Line II™ (ATPOL II™) and then subjected to rapid Fourier analysis, allowing technicians to assess both the electrical and mechanical condition of the motor system.
ความผิดปกติของระบบมอเตอร์ (ไม่ว่าจะเกี่ยวข้องกับกำลังขาเข้า ไฟฟ้าของมอเตอร์หรือกลไกของมอเตอร์ ข้อต่อทางกล หรือโหลดที่ขับเคลื่อน) ทั้งหมดจะมีลายเซ็นเฉพาะเมื่อใช้เทคนิค ESA (ดูรูปที่ 1) ดังนั้น ด้วยข้อมูลเกี่ยวกับมอเตอร์และระบบมอเตอร์ จึงสามารถระบุความถี่ความผิดปกติที่เกี่ยวข้อง และสามารถประเมินทั้งระบบได้
ข้อบ่งชี้ประสิทธิภาพหลายประการจะถูกเปิดเผยภายในโดเมนเวลาและความถี่ที่ให้ข้อมูลที่จำเป็นเพื่อพิจารณา ‘สภาพ’ ของมอเตอร์และผลกระทบของโหลดที่ส่งมอบ ซึ่งจะทำให้สามารถ ‘มองเห็น’ ความเร็วในการวิ่งที่แท้จริง ความถี่การสลิปของมอเตอร์ ความถี่ของเฟืองเกียร์ ส่วนประกอบของชุดขับเคลื่อน และความเร็วในการหมุนของเฟือง
การแปลงฟูเรียร์แบบรวดเร็ว (FFT) ใช้เพื่อสร้างสเปกตรัมความถี่สูงและต่ำ จุดสูงสุดในสเปกตรัมเหล่านี้สอดคล้องกับความเร็วในการหมุนของส่วนประกอบต่างๆ ในเครื่องจักร ตัวอย่างเช่น ในกรณีของพัดลมที่ขับเคลื่อนด้วยมอเตอร์ไฟฟ้าผ่านสายพาน ยอดจะสัมพันธ์กับความเร็วของมอเตอร์ ความถี่ในการผ่านขั้ว ความเร็วพัดลม และความเร็วของสายพาน หากใช้กล่องเกียร์แทนการขับเคลื่อนด้วยสายพาน ยอดสเปกตรัมจะปรากฏขึ้นที่ความเร็วการหมุนของเฟืองและความถี่การประกบเฟือง
ดำเนินการวิเคราะห์ลายเซ็นไฟฟ้า
ข้อมูลป้ายชื่อไม่จำเป็นต้องใช้ในระหว่างกระบวนการรวบรวมข้อมูล แต่การวิเคราะห์อัตโนมัติสามารถทำได้โดยการป้อนแรงดันไฟฟ้าของป้ายชื่อมอเตอร์ ความเร็วในการทำงาน กำลังพิกัด และกระแสโหลดเต็มในระหว่างกระบวนการวิเคราะห์ ข้อผิดพลาดทั่วไปของระบบกลไกระหว่างมอเตอร์และโหลดเนื่องจากการสึกหรอและการใช้งาน ได้แก่ การวางแนวของสายพานหรือไดรฟ์ตรงที่ไม่ตรง การสึกหรอของสายพานหรือเม็ดมีด ปัญหาความตึงของสายพาน และการสึกหรอของมัด โหลดอาจมีข้อผิดพลาดหลายประเภท ขึ้นอยู่กับประเภทของโหลด ที่พบบ่อยที่สุดคือชิ้นส่วนที่สึกหรอ (เช่น ซีล) ส่วนประกอบที่แตกหัก (เกียร์ พัดลม ใบพัด ฯลฯ) และแบริ่ง
ซอฟต์แวร์ ESA ช่วยให้ช่างเทคนิคป้อนข้อมูลเกี่ยวกับระบบกลไกได้ (ดูรูปที่ 2) จากนั้นความถี่ที่เกี่ยวข้องจะถูกคำนวณโดยอัตโนมัติ (ซอฟต์แวร์จะมีเคอร์เซอร์สำหรับค้นหาความถี่เหล่านี้ภายในสเปกตรัม) การวิเคราะห์อุปกรณ์ขับเคลื่อนประกอบด้วยอุปกรณ์แบบมีสายพาน เกียร์ และอุปกรณ์มีใบมีด โปรดทราบว่าข้อมูลระบบกลไกไม่จำเป็นสำหรับการวิเคราะห์ทางไฟฟ้าและทางกลของมอเตอร์ และจะเกี่ยวข้องเฉพาะเมื่อจำเป็นต้องวิเคราะห์โหลดทางกลเท่านั้น
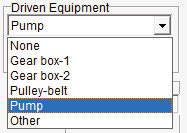
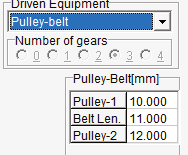
รูปที่ 2. ซอฟต์แวร์การวิเคราะห์ลายเซ็นไฟฟ้าจะทำการคำนวณโดยอัตโนมัติและจัดให้มีเคอร์เซอร์ความถี่
ตามตัวอย่าง ลองดูข้อมูลความถี่ต่ำจากพัดลมเก็บฝุ่น 1 ที่ขับเคลื่อนด้วยมอเตอร์เหนี่ยวนำขนาด 150 กิโลวัตต์ 400 โวลต์ 260 แอมป์ 1485 RPM (ดูรูปที่ 3) สังเกตจุดสูงสุดที่มีป้ายกำกับ BLT – นี่คือความถี่ของสายพานหรือความเร็วของสายพาน BLT มีจำนวนทวีคูณ ซึ่งแสดงในสเปกตรัมทั้งสอง สเปกตรัมด้านล่างแสดงจุดสูงสุดของความถี่เส้นและมีแถบด้านข้างทั้งสองด้านของความถี่เส้นซึ่งอยู่ที่ความถี่ BLT ความจริงที่ว่าความถี่ของสายพานมีอยู่ โดยเฉพาะที่ 4.3 แอมป์ ถือเป็นเรื่องสำคัญ แถบด้านข้างได้รับการประเมินโดยข้อเท็จจริงที่ว่ามีอยู่ นอกจากนี้ ความถี่ของสายพานยังทวีคูณด้วย ดังนั้น ฉันจึงสงสัยว่ามีปัญหาบางอย่างกับตัวสะสมนี้ อย่างไรก็ตาม ช่างเทคนิคที่รวบรวมข้อมูลนี้และทำการวิเคราะห์เบื้องต้นเลือกที่จะตรวจสอบเครื่องนี้เทียบกับทำการตรวจสอบหรือทดสอบเพิ่มเติม
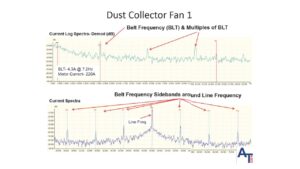
รูปที่ 3. พัดลมเก็บฝุ่นนี้ขับเคลื่อนด้วยมอเตอร์เหนี่ยวนำ 150 กิโลวัตต์ 400 โวลต์ 260 แอมป์ 1485 RPM
A related unit, the Dust Collector Fan 2, was also tested. In Figure 4, note that the motor load is lower than Fan 1 (194A vs. 220A), but the peak BLT is 8.3A; while Fan 1 only peaks at 4.3A. From this initial test, we cannot conclude that this is a serious problem, but it serves as a warning sign that something is different in this unit compared to the first one.
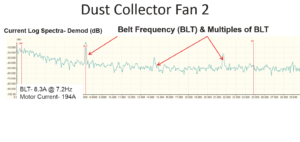
Figure 4. Results of the dust collector fan test 2.
Since this information was used during the detection phase of the PdM process, the next step is to begin the analysis phase. During the analysis phase, the technician performed a quick visual inspection of both machines and observed that the belt with fan 2 had excessive belt movement compared to fan 1. The next step involves some further work, which may include obtaining additional data with the ESA or introducing other tools as part of the analysis process.
Summary
Electric motors make excellent transducers when using electrical signature analysis, as it allows you to assess input power, the motor’s electrical and mechanical condition, and the driving load. In terms of power quality, control, stator and rotor condition, air gaps, bearings, alignment, and load, developing faults and trends can be detected for predictive maintenance purposes. However, you need the right equipment before you can perform electrical signature analysis.
This application story is part of a three-part series on using ESA to assess the condition of motor-driven mechanical systems.
For more information, please visit www.alltestpro.com.
About ALL-TEST Pro, LLC
ALL-TEST Pro delivers true commitment to motor maintenance and troubleshooting with innovative diagnostic tools, software, and support to help you keep your business running smoothly.
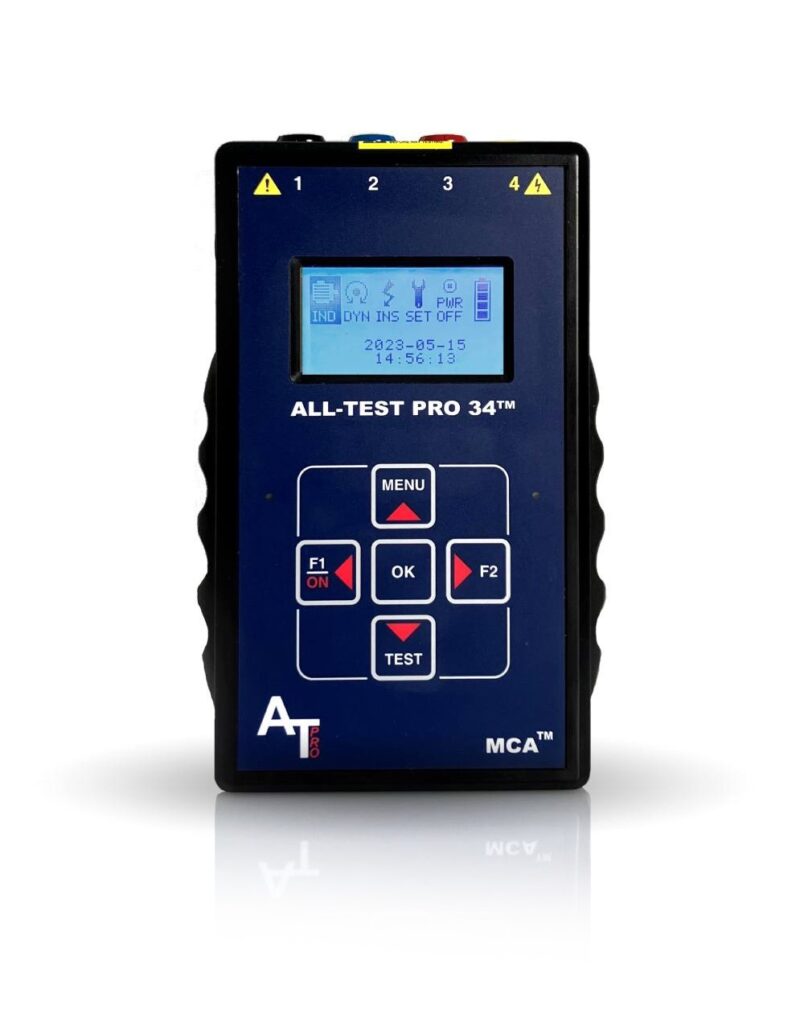
AT34™
วิเคราะห์และแนวโน้มความสมบูรณ์ของส่วนประกอบมอเตอร์สำหรับความผิดปกติของกราวด์ ความผิดปกติของขดลวดภายใน การเชื่อมต่อแบบเปิด และการปนเปื้อน – ทั้งหมดนี้ทำได้ด้วยอุปกรณ์มือถือเครื่องเดียว