電気信号解析によるオンライン・モーター試験
Online Electric Motor Exam 101
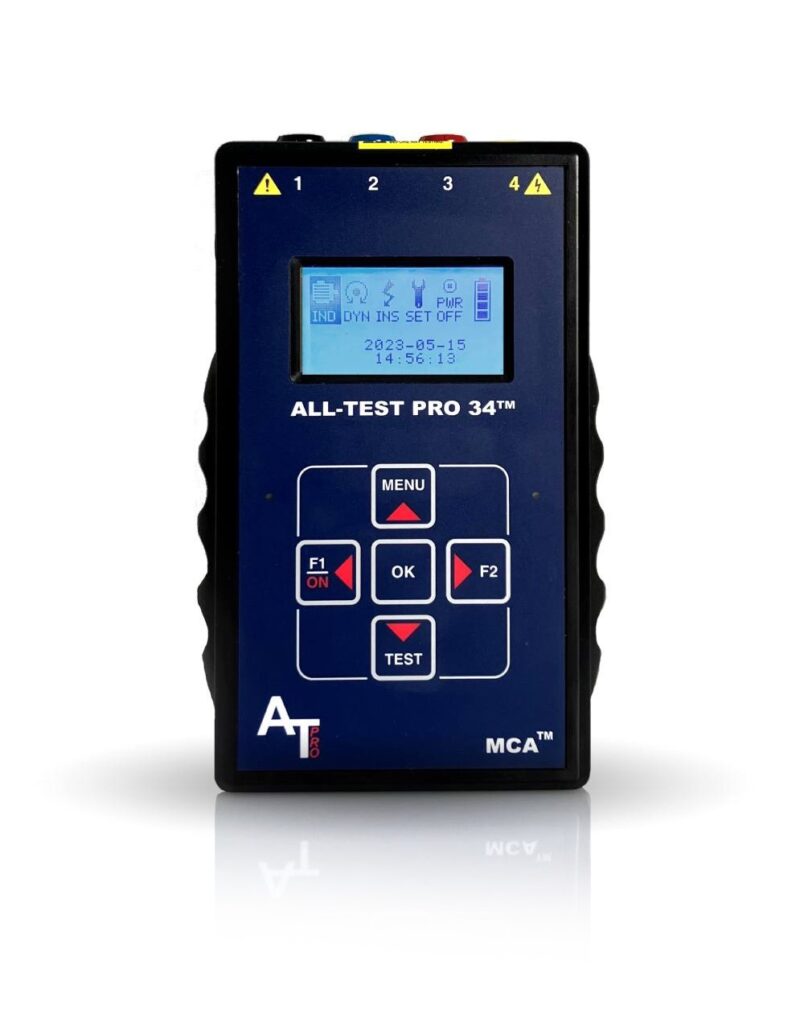
Electrical Signal Analysis (ESA) is an online testing method that captures voltage and current waveforms during motor system operation and performs spectral analysis using Fast Fourier Transform (FFT) with accompanying software. From this FFT, faults related to input power, control circuits, the motor itself, and the driven load are detected and trends identified for condition-based/predictive maintenance purposes. Our ESA equipment is handheld, portable, and battery-powered.
All ESA analysis systems require motor nameplate information: voltage, operating speed, full load current, and horsepower (or kW). Additionally, optional information such as rotor bar and stator slot count, bearing number, and driven load component information such as blade count for fans or teeth count for gearbox applications can be entered for more detailed and accurate analysis.
Energized online testing provides valuable information for AC induction motors, DC motors, generators, wound rotor motors, synchronous motors, machine tool motors, etc. Since ESA is new to many, the chart below shows its evaluation capabilities for key components within a motor system.
![]()
Power quality analysis also conducted
- Power Quality Data Logging
- Logging of 3 voltage channels and 4 current channels is possible
- Event waveform capture ≥ ½ cycle
- Transient detection for events longer than 8 microseconds
- Energy data logging – Harmonic analysis (V and I) up to 63rd order
- Phase Graph – Easy to Use Report Template
- Before and after analysis function to report energy savings
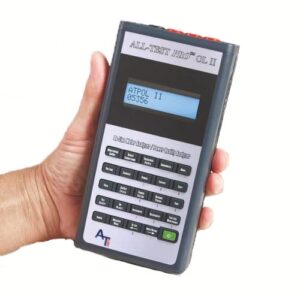
Online testing using electrical signal analysis
All Exam Pro II (ATPOL II™)
- Royal Electricity Transmission Station
- power quality
- Sagging and swell
- Waveform Capture
- Energy Data Logging
Successful ESA application
- AC/DC motors
- Motor Drive Applications
- Generator/Alternator
- Traction motor
- Machine tool motors
- gearbox
- Pumps and Fans
- For reliability
- Commissioning
- For troubleshooting
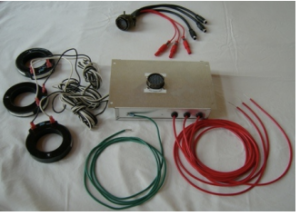
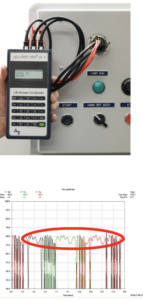
The ALL-SAFE PRO™ Junction Box allows technicians to collect online test data without opening live panels.
Automatic Fault Detection
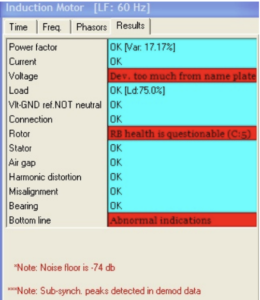
Below is an example of an AC induction motor with a squirrel cage rotor.
Data is collected via portable voltage and current probes or a permanently installed junction box (ALL-SAFE PRO TM).
The collected data is analyzed using the provided software.
Pre-configured alarms and automatic report templates are provided for AC induction, synchronous and DC motors and transformers.
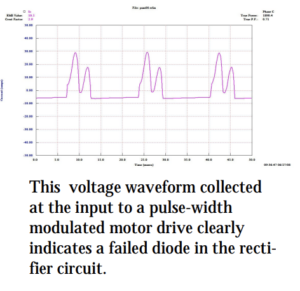
Excessive ripple in this voltage waveform indicates a faulty capacitor in this pulse-width modulated motor drive. For more information on testing PWM motor drives with an ESA, please email us at [email protected].
Incident power analysis
- Power factor
- Current and voltage imbalance
- Effective voltage to nameplate
- Voltage and current peak and crest factors
- Phase Impedance
- Power (apparent power, real power, reactive power)
- Total Harmonic Distortion (Voltage and Current)
Motor power supply analysis
- Rated load
- THDF (Transformer Harmonic Distortion Factor)
- VDF (Voltage Derating Factor)
- THDF and VDF products can be used for horsepower derating.
- Demand Power
- Sum of negative, positive, and zero-series harmonics
- AC induction and DC motor efficiency
- *Use with the U.S. Department of Energy’s Motor Master+ software program to help you decide whether to repair or replace. MM+ also calculates the payback of upgrading to an energy-efficient motor.
Motor Analysis
- Line Frequency
- driving speed
- Pole path frequency
- Rotor Health
- Air gap (static and dynamic eccentricity)
- Misalignment/imbalance
- Stator Electric
- Stator Mechanical
- Phase connection integrity
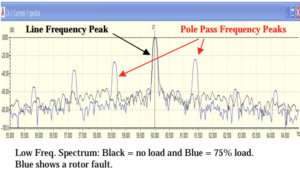
The analysis software has a comparison function that allows you to overlay one spectrum on another for comparison. The figure below shows the motor FFT spectrum at no load and at 75% load. The small blue peaks on either side of the large blue peak are called pole-path frequencies. These peaks are caused by multiple broken rotor bars.
Load Analysis
After inputting information into the software, the mechanical system can be analyzed.
- Direct connection
- gearbox
- Belt included
- Fan blade
- impeller
Learn more about online analysis
One of the key operations of the ATPOL II software is to perform a root-mean-square demodulation process on the power line carrier signal to provide a highly sensitive and selective means of extracting the current signal from the motor load. Demodulating the raw current signal in this way removes large line frequency components and significantly improves the signal-to-noise ratio of modulation-causing components such as road speed, belt passing, and gear meshing.
Numerous performance indications are revealed in the time and frequency domains that provide the information needed to determine the “health” of the motor and the effects of loading, allowing you to actually “see” true road speed, motor slip frequency, gear mesh frequency, drivetrain components and gear rotational speed.
A Fast Fourier Transform (FFT) is used to separate the various frequencies, and the resulting frequency spectrum is displayed on the screen. The peaks in this spectrum correspond to the rotational speeds of the various components of the machine. For example, in the case of a fan driven by an electric motor via a belt, peaks will correspond to the motor RPM, the pole passing frequency, the fan RPM and the belt RPM. If a gearbox is used instead of a belt drive, peaks in the spectrum will appear at the gear rotational speed and the gear meshing frequency.
The height of these spectral peaks depends on two things: the overall current level flowing to the motor and the amplitude of mechanical disturbances emanating from the machine and sensed by the motor. Mechanical disturbances begin as torque fluctuations and ultimately reach the motor as small speed fluctuations, which in turn cause small measured current fluctuations. At a constant total speed, for example, a change in the height of the fan speed peaks indicates a deterioration in the fan’s mechanical condition. By observing these changes, faults such as imbalance, misalignment, worn drive pulleys, or bad bearings can be easily identified. Therefore, after periodic data acquisition, frequency displays can be used to monitor electric motor-driven machinery to provide early warning of potential deterioration.
The main difference between Motor Current Signature Analysis (MCSA) and Electrical Signature Analysis (ESA) is that in MCSA, the FFT is performed only on the current waveform, not the voltage. This makes it difficult to easily and quickly distinguish input power-related issues from motor or driven load issues. In ESA, the FFTs of the current and voltage can be viewed on the same screen. Therefore, the cause of the fault can be identified simply by comparing the voltage and current FFT spectra.
Generally, if the peak dominates the voltage spectrum, the source of this peak is going into the motor. If the peak dominates the current spectrum, the cause is motor or load related.
ESA failure patterns
Type of failure
Stator mechanical CF = RS x LF stator slots with sidebands
Static eccentricity CF = RS x rotor bars with LF and 2LF sidebands
Mechanical imbalance/misalignment using proprietary algorithms
Dynamic eccentricity CF = RS x rotor bar LF and 2LF sidebands and RS sideband
Stator Electrical (Short) CF = RS x Stator Slot LF Sideband and RS Sideband
CF = Center frequency RS = Running speed LF = Line frequency