机器监控以及 ESA 技术如何提升工厂可靠性
作者:William Kruger,ALL-TEST Pro威廉-克鲁格,ALL-TEST Pro
全球有超过 3 亿台电机用于基础设施、大型建筑和工业。 这些电机的耗电量约占工业耗电量的 2/3。 工厂的几乎所有区域都需要用电,以提供驱动力来操作生产产品的设备或提供工厂设备所要提供的服务。 电力是一种独特的产品,因为它需要持续流动,无法方便地储存,而且在使用前通常不会进行检查。 大多数人认为,电力可靠性的终点是成功地将电力输送到发电厂,如果打开开关或按下按钮后,灯亮了或电机启动了,那么电力就是可靠的。 但在很多情况下,电机系统的供电质量可能是导致故障或失灵的原因。 低 “电能质量 “的结果通常是长期的,而且往往被忽视为问题的根源或促成因素。 了解输入电源的质量、电机的机械和电气状况以及驱动器的机械状况,对所有设备保持正常运行时间和节约成本都非常重要。 为此,工厂实施了测试、状态监测或预测性维护计划 PdM。 许多检测仪器都能提供测量结果、图表和报告,它们能对电机状况发出警告和提示,而不是给出答案。 通过在设备运行时提供快速、可靠的答案,ESA 技术可为您提供有关电机、驱动器和电力健康状况的答案。
电机电路分析 MCA 可提供断电状态下电机绕组和接地绝缘系统的可靠健康状况。 有些机器是连续运行的。 为了对设备进行评估,工业界在工厂中实施了预测性维护计划,以便在设备故障导致昂贵的设备停机或灾难性故障之前发现它们。 因此,这就需要能够在设备运行时对其进行测试的技术。 机械振动分析 (MVA)、热成像、超声波等 PdM 技术都提供了一些有价值的信息,可以在设备运行时识别出工厂配电或旋转设备中的特定故障。
然而,并非所有的 PdM 计划都是一样的,最有效的计划会认识到多种技术的必要性。 最有效的预测性维护计划包括以下三个阶段 1) 检测、 2) 分析,以及 3) 更正。
预测性维护检测阶段:
1) 尽快扫描尽可能多的机器
2) 找出尽可能多的潜在问题
3) 提供尽可能多的诊断信息
在检测阶段之后的分析阶段确定了健康状况出现任何恶化的设备。 在这一阶段,可能需要使用相同的技术或在某些情况下使用其他技术进行更多更详细的测试,以确定机器内的条件发生了哪些变化或出现了哪些故障。 在某些技术中,初始检测过程可能会提供一些异常原因的指示。 因此,检测和分析之间始终存在着一条微妙的界限,这就是最佳的 PdM 技术。
纠正阶段则是针对发现的故障制定行动计划。 例如,如果故障是不平衡,是否可以在现场纠正,还是必须在车间进行平衡。 如果检测到轴承缺陷,可以根据故障成本与生产损失等多种因素,缩短监测间隔,直至机器在运行允许的情况下经济地停机或立即停机。
常见的预测性维护工具。
机械振动分析 – 振动是旋转设备最常用的技术之一。 根据定义,振动是围绕静止点的周期性前后或上下运动。 振动可以检测和识别各种机械故障和工艺故障。
由 MVA 确定的典型故障:
机械失衡
错位–包括软脚
偏心转子
弯曲轴
裂纹轴松动
非旋转部件之间
旋转部件和非旋转部件之间
旋转部件松动
叶片和叶片传递问题
齿轮箱问题
滚动体轴承缺陷
转子摩擦
工艺问题:
气蚀
流动或空气动力问题
交流感应电机问题:
转子问题:转子杆断裂、偏心转子(动态偏心)、热敏感转子
定子问题:气隙不均(静态偏心)、软脚、绕组松动或定子搭铁
电机控制器问题:
VFD 控制器的一些有限故障
直流电机控制器的一些有限故障
优点是非侵入式测量,易于获得测试数据,得到广泛应用和认可。 缺点:无法显示电能质量状况或任何其他电气问题,依赖于牛顿定律 F=mA 来显示初期故障。 这意味着检测故障的能力取决于机器的质量,较大的机器需要更大的力量,在许多情况下,故障会被完全忽略,尤其是在早期阶段。 因此,由于质量的原因,根据测量值得出的故障严重程度不一定具有可比性。 举例来说,如果将较小机器上的不平衡力施加到较大的机器上,所产生的振动会降低,但施加到轴承上的力是相同的。
MVA 的其他考虑因素是,振动是有方向性的,而振动传感器也是单向的,因此它们只能测量方向上的运动。 此外,这些传感器只能测量位置或安装点的运动。 要评估所有运动方向的运动情况,通常需要在每个点进行三次测量。 此外,并非所有传感器都能测量相同的运动,有些传感器测量的是相对运动,而有些传感器测量的是绝对运动,而且不同的传感器有不同的频率范围。
红外线–热量与振动一样,也是系统内部出现问题的良好指标,热成像技术已被证明对电气领域的连接问题非常有用。 使用该技术还可以发现其他问题,如电流不平衡和设备各区域的热点,但通常在产生足够热量时,故障一般已经发展成熟,在某些情况下,温度实际上会随着故障的发展而降低。 热成像技术的优点是非侵入性,易于进行测量。 缺点:最大的缺点可能是视线问题,为了识别故障,摄像头必须能够看到故障区域,很多时候,故障可能隐藏在面板后面、耦合盖下面、机柜或导管里面。 此外,热成像技术的诊断能力非常有限。 当温度升高时,可能有很多原因,需要额外的测试、技术和可能的检查来确定甚至验证原因。
超声波 – 是公认的非常有用的 PdM 技术。 超声波仪器可检测到人耳听不到的空气传播和结构传播的超声波,并通过电子方式将其转换为可听范围。 然后可以使用耳机监测这些改变的信号,或在显示屏上查看时间波形显示或 FFT。 这样,训练有素的技术人员就能及早发现旋转设备中的滚动轴承缺陷、空气系统中的漏气、高压导体上的电晕放电或电气系统中的跟踪。 超声波的优点是非侵入性,在设备运行时进行,相对容易操作。 缺点:问题检测有限,超声波只能识别少数故障,而且结果通常非常主观,取决于技术人员的经验。
这些常用技术都无法提供从输入电源到过程本身的整个电机系统的指示。 在某些情况下,电机系统健康状况下降的唯一迹象就是电机运行发热或可能跳闸。
工厂很快就认识到将电气特征分析作为其 PdM 计划关键要素的优势。 他们开始认识到,ESA 并不是用于识别晦涩难懂、非常罕见或难以识别的电气异常的专门测量技术,而可能是目前最有用、最全面的 PdM 技术。
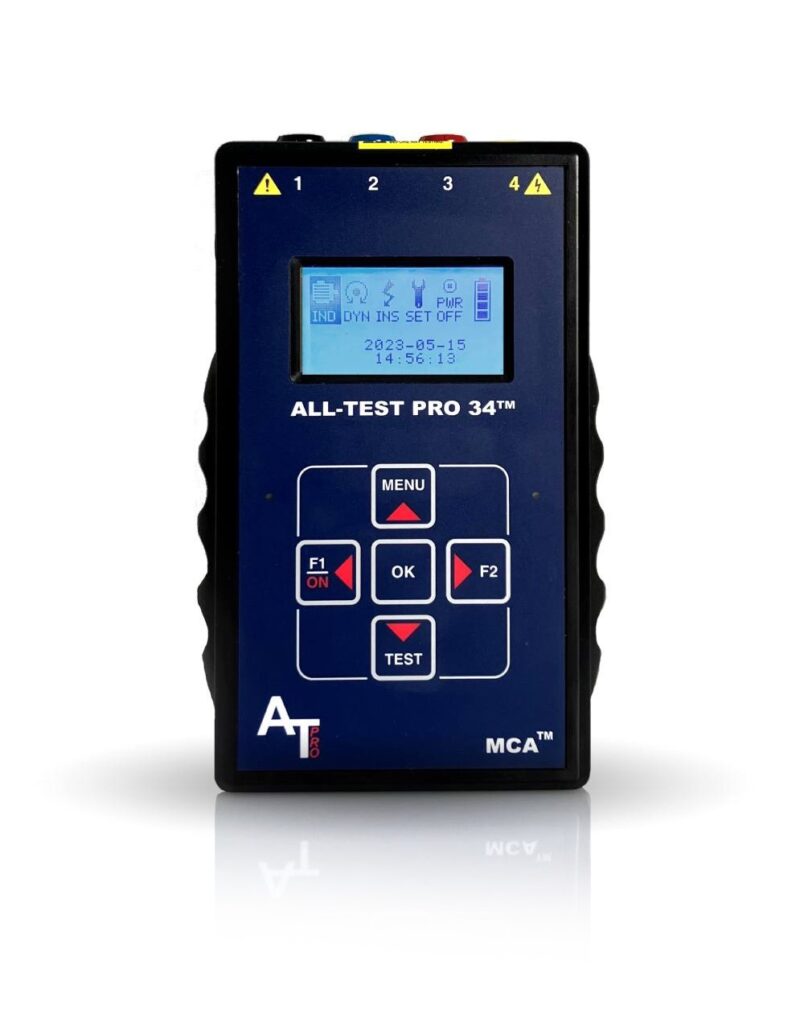
将 ESA 作为 PdM 技术实施首先要从仪器开始。 手持式 ATPOL II(图 1)在电机控制器上执行 50 秒钟的数据采集,以测量整个电机系统的状况。 这款便携式轻便仪器可同时捕获并存储所有三相电压和电流,用于电能质量分析,还可实时捕获所有三相电压和电流的 50 毫秒时间波形,用于直观检查这些非常重要的信息
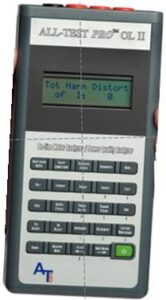
图 1 ATPOL II
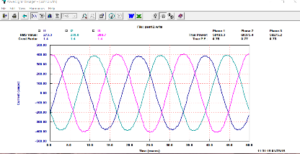
图 2 50 毫秒 3 相带电电流波形
图 2 欧空局还在内部对电气设备的电压和电流时间波形进行模数转换,并存储起来上传到主机。 电气特性分析 (ESA) 是一项经过现场验证的简单有效的技术,可验证电机的电能质量以及电机和驱动器的健康状况。
All acquired and stored data can be uploaded to the host via wireless Bluetooth connection, 2Gbyte SD card, or serial cable. The provided Power System Manager (PSM) and ESA software programs offer the necessary graphs, tables, analyses, and reports, making them very powerful PdM tools for comprehensive analysis of the entire motor system.
Motor current is a highly efficient and effective sensor, without the limitations associated with vibration sensors. Any periodic force or disturbance within the motor system will cause the motor current to adjust at the frequency of the force or disturbance. Anomalies in the motor current originate downstream of the motor controller, while voltage anomalies stem from the input power supply. By identifying any discrepancies in the voltage and current data, the cause of a fault can be differentiated between an input power supply (upstream of the controller) and a fault related to the motor, drive mechanism, or process (downstream of the controller). When the machine is running under any load, the ESA can assess the health of the entire motor system in less time than it would take to measure the vibration of a single bearing using mechanical vibration.
Powerful ESA analysis software performs FFT on uploaded digitized waveforms and transforms this data into the tools, charts, and displays needed for in-depth analysis of the entire motor system. This analysis begins with the input power supply (voltage data) and identifies faults, disturbances, or anomalies through the electrical equipment, drive machinery, and the process itself. Proprietary algorithms are applied to this translated data and identify faults. Automated analysis capabilities make many previously difficult-to-detect faults easily identifiable. By inputting specific mechanical details readily available from the motor nameplate, ESA can generate a complete assessment of the entire motor system. Inputting information such as motor speed, voltage, full-load current, and rated power generates an easy-to-understand analysis report. For more detailed analysis, additional information such as the number of rotor rods and stator slots provides further diagnostics related to the motor’s internal condition, and fault-related markers quickly identify faults such as static and dynamic eccentricity (Figure 3).
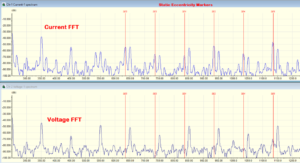
Figure 3 Fault marking
Mechanical faults can be automatically detected simply by entering additional machine information into the ESA analysis software, such as bearing number, belt circumference and pulley size, blades or number of blades on the impeller, or the number of teeth on the gear. Easily identifiable markers are inserted on the display to highlight the spectral peaks of these forces, enabling quick and accurate analysis of the driven machine. All faults detected by MVA can also be detected by ESA.
ESA uses the percentage of current or voltage interruption relative to the supply voltage or motor current to identify faults. This allows ESA to detect faults earlier because the response to such forces is not affected by machine quality or limited by the frequency response issues associated with vibration sensors.
In addition to identifying faults and anomalies, standard electrical formulas can be used to quickly assess the adverse energy impact of these faults.
Case Study: To emphasize the power of ESA, we briefly review the analysis conducted on a 700-horsepower three-phase AC motor driving a vertical pump at a water plant. Recent mechanical vibration tests showed very low overall vibration levels and smooth operation, with vibration analysis providing a “maintenance-free” recommendation for the motor system. Several more tests were conducted over the following months, but the cause of the problem remained unclear. It was then decided to perform ESA testing on the motor under test, conducting 2-50 second ESA tests concurrently with the mechanical vibration tests.
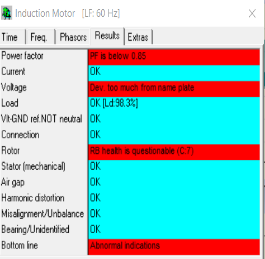
Figure 4 Automatic Analysis Report
The complete ESA analysis, shown in Figure 4, and the report were created while vibration data was still being collected. Two weeks later, the vibration report still indicated that the vertical pump required no maintenance. An automatically generated, field-completed ESA report identified several damaged rotor shafts, as shown in Figure 5. The automatic grading system indicated a severity of C:7 (out of 7), recommending immediate repair. The motor was operating under overload conditions.
![]()
Figure 5 Rotor shaft health report
The time-tracking of the motor current shows that the motor current fluctuated by 50 amps between 775 amps and 825 amps (Figure 6). The motor speed was also 15 RPM lower than the nameplate speed. Applying Joule’s law from bottom to top, the fault caused the motor to modulate by 55 HP (Figure 6). The FFT shows that the modulation frequency is at the pole passing frequency, which is a key indicator of rotor magnetic grating problems.
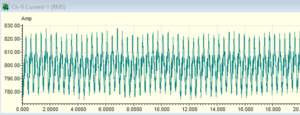
Figure 6. Root mean square current trajectory before repair
Joule’s law for three-phase power in watts. Power = Voltage (V) multiplied by Current (I) P = V x I x 1.73
Inspection revealed that over 30% of the rotor shaft was damaged. The motor was then sent to the manufacturer for rotor reconstruction and shaft replacement. After repair, the motor current was within the normal range, decreasing from 800 amps to 757 amps without modulation. The motor speed reached the expected range, and the motor operating temperature was normal (Figure 7).
Although previous vibration data indicated that the motor had no problems before the repair, the overall vibration level decreased by more than 50% after the repair.
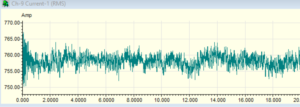
Figure 7. Repaired root mean square current trajectory
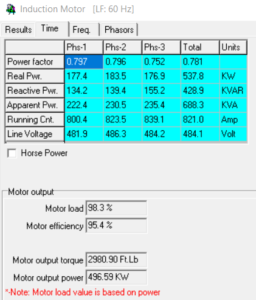
Figure 8 Power Quality Table
In conclusion, because ESA uses motor voltage and current as sensors to determine electrical and mechanical faults in electrical equipment, it has quickly been recognized as an ideal tool for detecting electrical and mechanical faults and can be used for predictive maintenance of any type of electrical equipment. This means that motors, generators, or transformers can be tested. Furthermore, ESA can analyze complex faults or anomalies within power distribution systems. This powerful tool can be used not only for various AC motors but also for any electrical equipment to display the overall health of the entire electrical system. In less than a minute, all the information needed for a comprehensive assessment of the motor system can be obtained, providing a complete power quality table (Figure 8) that defines input power, motor load, and motor efficiency. Through waveform capture, analysts can identify insulation breakdowns or loose connections anywhere in the electrical system. ESA is a key technology for accurately analyzing electrical and mechanical faults in rotating equipment; using ESA, the actual motor speed at 1 RPM can typically be calculated from the captured data. As with all other PdM technologies, as more users adopt the new technology, we will discover more uses, techniques, and functions. Since this is a relatively new technology, new features are currently under development.