Machine Monitoring and How ESA Technology Can Upgrade Your Plant’s Reliability
By: William Kruger, ALL-TEST Pro
More than 300 million electric motors are used in infrastructure, large buildings, and industry globally. These motors account for about 2/3rds of the industrial power consumption. Electricity is required in almost all areas of the plant to provide the driving force that either operates the equipment that produces the products or provides the services that the plant’s equipment was built to perform. Electricity is a unique product in that it requires continuous flow, cannot be conveniently stored, and is normally not inspected prior to use. Most people believe that electrical reliability ends with the successful delivery of power to the plant, if the light goes on or the motor starts when the switch is flipped, or the button pushed then the electricity is reliable. But in many cases, the quality of the power supplied to the motor system may be the cause of a breakdown or failure. The result of poor “power quality” is usually long term and often overlooked as the source or contributor to the problem. Knowing the quality of the incoming power, along with the mechanical and electrical condition of motor and the mechanical condition of the drive are important at all facilities to maintain uptime & save money. To this means plants have implemented testing, condition monitoring or predictive maintenance programs PdM. Many testing instruments are available that provide the measurements, graphs and reports which provide warning and alerts rather than answers to the condition of your motors condition. ESA technology provides answers related to the health of your motors, drives and electricity by providing fast, reliable answers while the equipment is operating.
Motor Circuit Analysis MCA provides reliable health condition of the motors winding and ground wall insulation systems in the deenergized state. Some machines run continuously. To evaluate this equipment industry has implemented predictive maintenance programs in plants to identify equipment faults before they result in a expensive equipment shutdown or catastrophic failure. So, this requires technologies that can test equipment while they are operating. PdM technologies such as machinery vibration analysis (MVA), thermography, ultrasound have all provided some valuable information identify specific faults in either the plants distribution or rotating equipment while the equipment is in operation.
However, not all PdM programs are the same and the most effective programs recognize the need of multiple technologies. The most effective predictive maintenance programs have three phases of 1) detection, 2) analysis, and 3) correction.
Predictive Maintenance Detection Phase:
1) Scans as many machines as quickly as possible
2) Identifies as many potential issues as possible
3) Provides as much diagnosis as possible
The analysis phase follows the detection phase has identified the equipment that has exhibited any degradation in health. This phase may require additional more detailed tests using the same technology or in some cases other technologies to determine what condition within the machine changed or what fault occurred. In some technologies the initial detection process may be provide some indication as to the cause of the anomaly. So, there is always a fine line between detection and analysis, the optimum PdM technology.
The correction phase creates a plan of action for the identified fault. For instance, if the fault is unbalance, can it be corrected in the field or is it necessary to balance in a shop. If a bearing defect is detected, the action may be to simply reduce the monitoring intervals until the machine can be shutdown economically as operations permit or shutdown immediately depending several factors, including cost of failure vs lost production.
Common predictive maintenance tools.
Machinery Vibration Analysis – Vibration is one of the most commonly used technology on rotating equipment. By definition, vibration is the periodic back and forth or up and down motion about a point of rest. Vibration can detect and identify a wide variety of mechanical and process faults.
Typical faults identified by MVA:
Mechanical Unbalance
Misalignment- including soft foot
Eccentric rotor
Bent Shaft
Cracked Shaft Looseness
Between non-rotating components
Between rotating and non-rotating components
Loose rotating components
Blade & vane passing issues
Gear Box issue
Rolling Element bearing defects
Rotor rubs
Process Issues:
Cavitation
Flow or aerodynamic issues
AC Induction Motor issues:
Rotor issues: Broken rotor bars, Eccentric rotor (Dynamic Eccentricity), thermally sensitive rotors
Stator issues: Unequal air gaps (Static Eccentricity), Soft foot, loose windings, or stator iron
Motor Controller Issues:
Some limited faults on VFD controller
Some limited faults on DC motor controller
Advantages, non-invasive measurements, easy to obtain test data, widely used and accepted. Disadvantages, provides no indication of the condition of power quality, or any other electrical issues, relies on Newtons Law F=mA to indicate incipient failure. This means the ability to detect faults is dependent on the mass of the machine, larger machines require more force, in many cases faults are completely missed, especially in the early stages. So, the severity of the faults based on the measured values are not necessarily comparable due to the mass. As an example, if the same force created by unbalance on a smaller machine is applied to a larger machine the resultant vibration will be lower, yet the forces applied to the bearing would be the same.
Additional considerations with MVA is that vibration is directional and vibration sensors are unidirectional as well, so they only measure motion in the direction of orientation. Additionally, these sensors only measure motion at the location or mounting point. To evaluate motion in all directions of motion usually requires three measurements at each point. Additionally, not all sensors measure the same motion, some sensors measure relative motion whereas others measure absolute motion, and different sensors have different frequency ranges, Using the incorrect sensor or measurement often results in inaccurate assessment of the machines health.
Infrared – heat as with vibration is also a good indicator of developing problems within a system and thermography has proven very useful in the electrical arenas for connection issue. It is also possible to identify other problems as well such as current unbalance, and hot spots in various areas of the equipment using this technology, but usually by the time sufficient heat is generated the fault is generally well developed and in some cases the temperature may actually decrease as the fault progresses. Advantages of thermography is it is non-intrusive, easy to perform measurements. Disadvantages; perhaps the biggest disadvantage is line of sight, in order identify a fault the camera must be able to see the area, often times the fault may be hidden behind a panel, under a coupling cover, inside a cabinet or conduit. Additionally, thermography has very limited diagnostic capabilities. When temperature increases do occur, there are potentially many causes, additional testing, technologies and possibly inspections are required to determine or even verify the cause.
Ultrasound – Is recognized as a very useful PdM technology. Ultrasonic instruments detect airborne and structure borne ultrasounds which are inaudible to the human ear and electronically alters them to the audible range. These altered signals can then be monitored using headphones or viewed on a display as either a time wave form display or an FFT. This allows trained technicians to identify early stages of rolling element bearing defects in rotating equipment, air leaks in air systems, corona discharge on high voltage conductors, or tracking in electrical system. Advantages of ultrasonic is it is non-intrusive, performed while equipment is operating, relatively easy to perform. Disadvantages, limited problem detection, Ultra sonics only identify few faults and the results are usually very subjective and dependent on the technician’s experience.
None of these commonly used technologies provide indication of the entire motor system beginning at the incoming power through to the process itself. In some cases, the only indication of a motor systems declining health is the motor is running hot or possibly tripping.
Plants are quickly recognizing the advantages of using Electrical Signature Analysis as a key element of their PdM programs. They are beginning to understand that ESA is not a specialized measurement technique used to identify obscure, very rare or difficult to identify electrical anomalies, but is perhaps the most useful and comprehensive PdM technology available.
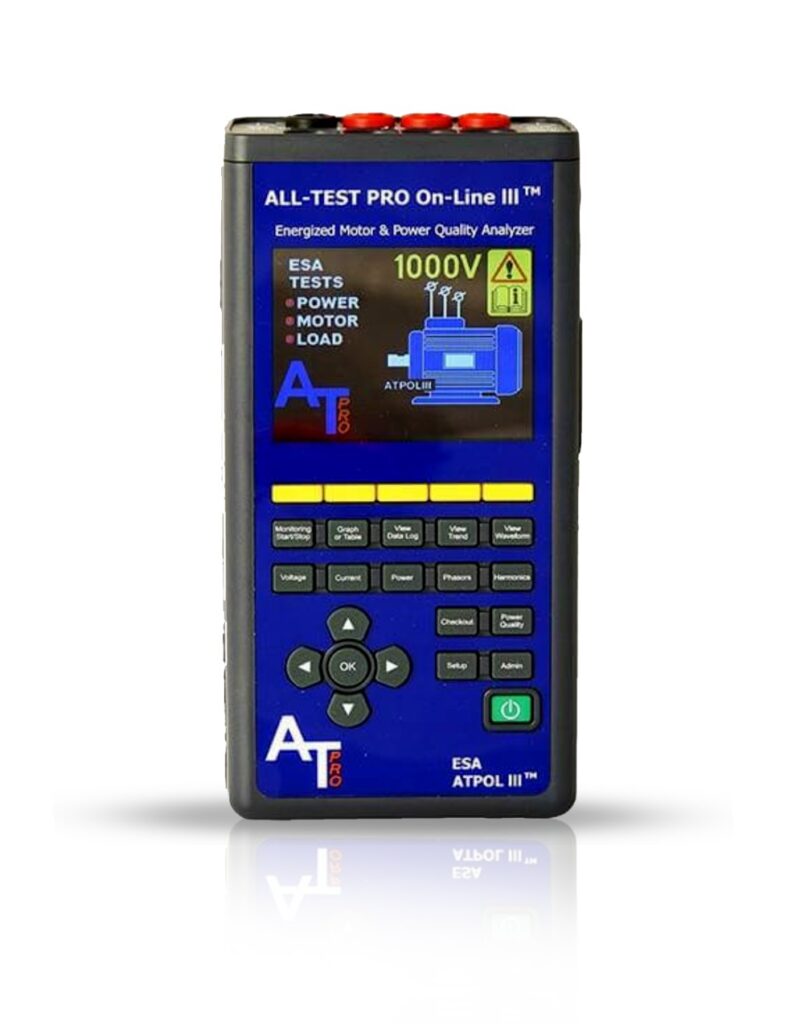
Implementing ESA as a PdM technology begins with the instrument. The handheld ATPOL II, Figure 1; performs a 50 second data capture at the motor controller to measure the condition of the entire motor system. This portable, lightweight instrument, performs and stores a simultaneous capture of all three phases of voltage and current for power quality analysis, and a live capture of 50 msec of all three phases of voltage and currents time waveforms for visual inspection of these very important information
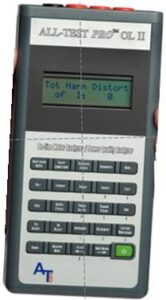
FIGURE 1 ATPOL II
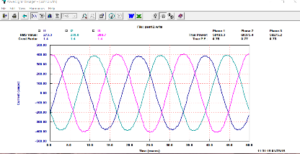
FIGURE 2 50 MSEC 3 PHASE LIVE CURRENT WAVEFORM
Figure 2;. ESA also internally performs an analog to digital conversion of the electrical equipment’s voltage and current time waveforms, stores for upload into a host computer. Electrical Signature Analysis (ESA) is a field proven simple effective technology that verifies the power quality coming to the motor as well as the health of the motor and the drive.
All the captured and stored data can be uploaded to the host computer using wireless Bluetooth connection, 2Gbyte SD card or a serial cable. The provided Power System Manager (PSM) and ESA software programs provide the graphs, tables, analysis and reports necessary to provide a very powerful PdM tool that provides a very thorough analysis of the entire motor system.
A motors current acts as a very efficient and effective transducer devoid of the limitations associated vibration sensors. Any cyclic force or disruption within the motor system causes the motors current to modulate at the frequency of the force or disruption. Anomalies occurring in the motors current are caused downstream of the motor controller, whereas anomalies in the voltage come from incoming power. By identifying any differences in the voltage and current data, the cause of faults can be separated between incoming power (upstream of the controller) or related to motor, driven machine, or the process (downstream of the controller). ESA assesses the health of the entire motor system while the machine is operating at any load, in less time than required to measure the vibration on one bearing using machinery vibration.
The powerful ESA analysis software performs an FFT on the uploaded digitized waveforms and translates this data into the tools, graphs and displays required for in-depth analysis of the entire motor system. This analysis identifies faults, disturbances or anomalies beginning with incoming power (voltage data) through the electrical equipment, the driven machine, and the process itself. Proprietary algorithms are applied to this translated data and identifies faults. Many faults which were previously difficult to detect are easily identified using the automatic analysis features. By entering specific machinery details which are easily accessible from the motor nameplate the ESA generates a complete evaluation of the entire motor system. Information such as motor speed, voltage, full load current and rated power are entered into the software which then creates an easy to understand analysis report. For more detailed analysis additional information that includes, number of rotor bars and stator slots provides further diagnostics relating to the internal condition of the motor, faults such as static and dynamic eccentricity quickly confirmed using fault related markers (Figure 3).
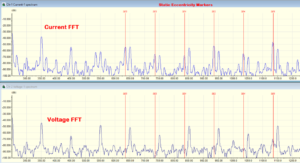
FIGURE 3 FAULT MARKERS
Mechanical faults can be automatically detected by simply entering additional machine information such as the bearing numbers; the belt circumference, and pulley sizes; the number of vanes or blades on impellers; or the number of teeth on gears, into the ESA analysis software the forces created by rolling element bearing defects, gears meshing, fan blade, pump vane passing, or belt issues can be easily identified by calculating the forces created when any of these faults occur. Easy to recognize markers are inserted into the displays to highlight the spectral peaks that identify these forces to analyze the driven machine quickly and accurately. All the faults that are detected by MVA can also be detected using ESA.
ESA uses the percentage of the current or voltage disruptions relative to supplied voltage or motor current to identify faults, this allows the faults to be detected earlier with ESA since the response to this forces is unaffected by the mass of the machine or are limited by the frequency response issues associated with vibration sensors.
In addition to identifying faults and anomalies standard electrical formulas can be applied to quickly assess the adverse energy effects these faults create.
Case study: To emphasize the power of ESA a quick review of an analysis conducted on a 700 HP three phase AC motor driving vertical pump in a water plant. The motor was running hot to the touch and the results from the machinery vibration testing recently performed showed the overall vibration levels were very low and considered to be running smooth, the vibration analysis provided the motor system recommendation of “no maintenance necessary”. Several additional tests were performed over the next couple of months, but questions remained as to the cause of the problem. It was then decided to perform ESA of the subject motor, 2 – 50 second ESA tests were performed simultaneously with machinery vibration tests.
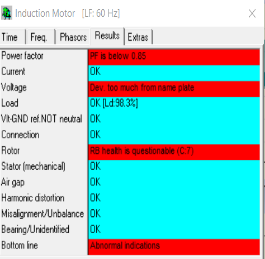
FIGURE 4 AUTOMATIC ANALYSIS REPORT
The complete ESA analysis See Figure 4 and report were created while the vibration data was still being collected. 2 weeks later the vibration report still gave the vertical pump no maintenance action required. The automatically generated the ESA report completed on sight identified several damaged rotor bars Figure 5. The automatic grading system noted a severity C:7 out of 7 and recommended immediate repair. The motor current running in an overload condition.
![]()
FIGURE 5 ROTOR BAR HEALTH REPORT
The time trace of the motor current indicated the motors current was modulating 50 amps from 775 to 825 amps (Figure 6). The motor speed was also running 15 RPM below nameplate. Applying Joules law from below the fault was causing the motor to be modulating 55HP (Figure 6). The FFT showed the frequency of the modulation was at pole passing frequency, which is the prime indicator rotor bars issues.
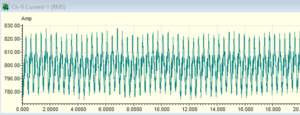
FIGURE 6 RMS CURRENT TRACE BEFORE REPAIR
Joules Law for Power 3 phase in watts. Power = Voltage (V) times Current (I) P=V x I x 1.73
Upon inspection over 30% of the rotor bars were found damaged, the motor was sent to the manufacturer to rebuild the rotor and replace the rotor bars. After repairs the motor current was within normal range dropped from 800 amps to 757 with no modulation. The motor speed was up to expected range and the motor was running at normal operating temperature (Figure 7).
Although the previous vibration data provided the motor a clean bill of health prior to the repair, the overall vibration levels were reduced by over 50% after the repair.
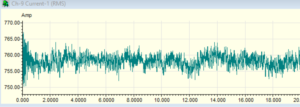
FIGURE 7 RMS CURRENT TRACE AFTER REPAIR
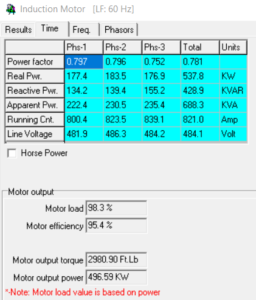
FIGURE 8 POWER QUALITY TABLE
Conclusion: Since ESA uses the motors voltage and current as the transducer to determine the electrical and mechanical of electrical equipment it is quickly being recognized as ideal the detection tool for both electrical and mechanical faults required for predictive maintenance for equipment that has any type electrical equipment. This means that motors, generators, or transformers can be tested. ESA also it provides the ability to analyze complex faults or anomalies within the electrical distribution system. This powerful tool be used on all varieties of AC motors but any electrical equipment as an indication of the total health of the entire electrical system. In less than a minute all the information required to compile a complete evaluation of the motor system, provides a complete power quality table (Figure 8) defining the condition of the incoming power, motor load and motor efficiency. The waveform capture allows the analyst to identifying insulation breakdown or loose connections anywhere in the electrical systems. The main key to accurately analyzing electrical and mechanical faults on rotating equipment, using ESA the actual motor speed can usually be calculated from the captured data with 1 RPM. As with all other PdM technologies as more users implement new technologies additional uses, techniques and capabilities are discovered. Since this is a relatively new technology new capabilities are being developed.
ATPOL III™
Comprehensively analyze power quality and electrical motor component integrity on AC/DC motors, generators, and transformers.

PVT-Hybrid Seminar MCA Level 1 – 08/04/2026-08/06/2026
8:30 am - 5:00 pm PLEASE CONTACT [email protected] AND MENTION REF#125-13896 FOR MORE INFORMATION. First Name * E-mail * Company Phone* Product of Interest* —Please choose an option—AT34EV™AT34™AT7™AT7™ PROFESSIONALATPOL III™MDIII™ALL-SAFE [...]
PVT-Hybrid Seminar ESA Level 1 – 08/11/2026-08/13/2026
8:30am-5:00pm EST PLEASE CONTACT [email protected] AND MENTION REF#125-13889 FOR MORE INFORMATION. First Name * E-mail * Company Phone* Product of Interest* —Please choose an option—AT34EV™AT34™AT7™AT7™ PROFESSIONALATPOL III™MDIII™ALL-SAFE PRO®AccessoriesSoftwareTechnical Support ConsultingOther [...]