EV Testing: State-of-Health Verification Moves to the Forefront
Dr. Mark Quarto CTO – Quarto Technical Services
After working for over 32 years in Electrified Vehicle technology, I have experienced most areas in the automotive development and engineering space. These experiences have transitioned from service engineer, propulsion/energy management diagnostic development engineer, Engineering Manager Vehicle Electrification Systems, Engineering Group Manager Vehicle Electrification Systems, and now (after retirement in 2012) consultant and instructor/mentor to OEMs, Remanufacturers, and the Aftermarket for Electrified Vehicle systems. I thoroughly enjoyed engineering some of the most advanced Electrified Vehicles in automotive history such as the GM EV1, Chevrolet Tahoe/Yukon 2-Mode Hybrid, Chevrolet Spark Electric, Chevrolet Volt, Chevrolet Equinox Fuel Cell Demonstration Fleet, and other advanced concept vehicles. As I’ve closely observed the industry for the past 20 years, it has been experiencing a true revolution in powertrain systems as Electrified vehicles (i.e., Hybrid, Plug-In, and Electric Vehicles) continue to populate the vehicle population. The used and second owner Electrified Vehicle market continues to elevate concerns about how technicians will confidently analyze and diagnose electric powertrain systems.

In particular, drive motor and generator (Electric Machines – EM) diagnostics and State-of-Health (SOH) analysis has moved center stage in automotive diagnostics and analysis. Automotive technicians have voiced a high level of interest in learning state-of-the-art analysis and diagnostic processes to aid in determining the SOH of an EM. As Electrified Vehicle products continue to age in the market, first owners of aged vehicles, second owners, and fleets are now raising the question “what is the condition of the drive motor and generator (stator and rotor) when determining the SOH of a vehicle?” Additionally, field technicians desire a method to “confirm” their analysis and diagnostic when targeting an electric powertrain failure condition. Specifically, OEM vehicle on-board diagnostics may not provide comprehensive analysis methods necessary for determining the health of an aged EM or provide clarity of determining whether a problem resides within the EM or its Power Inverter Module (PIM) system. Since the cost of an EM or PIM system can result in thousands of repair dollars, identifying and determining the root cause of the problem is essential. Furthermore, the labor time required to identify and confirm the root cause of a problem can be extensive, adding to the already substantial part cost of the repair. And, if the systems are misdiagnosed, the part and labor costs escalate significantly. One final thought to consider is neither the Aftermarket nor the OEMs have embedded EM SOH as part of a formal service testing process, as is the case for Internal Combustion Engine (ICE) technology. For example, if an automotive technician were queried on the causes for a traditional ICE misfire, variations in rpm, lean/rich condition, etc., it would be second nature for them to perform specific/targeted testing. Some of these engine tests would include cylinder balance, compression, cylinder leak-down, vacuum waveforms, ignition system testing, etc. These tests are endemic and wired in the DNA of how automotive technicians test, analyze, and diagnose automotive powertrain systems. However, if these same automotive technicians were to be queried on how to test an electric powertrain, most may be able to cite one or two types of tests but, be completely unfamiliar with the additional testing elements that are used in EM analysis and the associated failure modes. Here in lies the root gap between the current level of EM analysis and diagnostics in the automotive service field, versus the areas of testing that should be understood to provide a thorough analysis and diagnostic. In summary, the automotive service field is severely uninitiated in the field of EM powertrain analysis, diagnostics, and the skills to determine EM SOH.
The Road Less Traveled
When I’ve had conversations with many automotive technicians and instructors over the years, most will quickly admit that they have minimal experience in knowing how to test, analyze, and diagnose EM systems. Although technicians are well versed in the diagnostic methodologies for traditional automotive powertrains, their experiences are a road less traveled in the electric powertrain space. Throughout my 32-year career in Electrified Vehicle product engineering and service engineering, I have concluded that neither OEM Dealer or Aftermarket technicians have cultivated requisite EM analysis or diagnostic techniques, through training and experience. Much of this could be due because of automotive have been rooted in mechanical systems rather than electronic or electrically centric systems. Therefore, the core skillset of the traditional technician has not focused on electrical/electronic that, has limited the exposure of the technician to the electrical/electronic concepts so necessary to refine analysis techniques for electric powertrain systems. These comments are not meant to be a judgement. Rather, they are meant to provide observational feedback for the automotive service field to reflect on where it needs to go from here: a road less traveled.
I have also had close alliances with a significant number of technical schools, colleges, and university automotive technology and engineering programs for decades and can report that there are few institutions that target hard core Electrified Vehicle powertrain analysis and diagnostics. There may be any number of reasons for the state of this condition in our educational ranks but, irrespective of the causes, the result is technology gap that needs to be filled to assist technicians in training them to identify and confirm performance and SOH metrics through a solid analysis and diagnostic processes. Furthermore, providing automotive technicians analysis and diagnostic methods that reduce the time to learn analysis techniques and test Electrified Vehicle powertrains is the next critical step in enhancing and advancing technician skills in advanced electric systems.
Current State of EM Analysis and Diagnostics
Within the automotive service technology field, there are scant resources for technicians to acquire and utilize in the analysis and diagnostics of EM systems. The automotive OEMs have reduced technician training and test equipment to the bare minimum. Within the on-board diagnostics system, there are no diagnostics that monitor EM SOH. Most diagnostics are geared to identify catastrophic failures and parts of the EM have no diagnostic monitoring. Therefore, there is a significant gap in technology to assist the technician in prognostically identifying forthcoming EM failures so the vehicle owner can be apprised of electric powertrain SOH. The Aftermarket has more training options but, most individuals or company training providers are not professionally trained in electric powertrain system technologies. Moreover, the failure modes that an OEM Dealer will experience can be significantly different from those experienced in the Aftermarket. As for the training segment, most Aftermarket trainers/providers are typically self-taught and lack the professional training in the electrical and mechanical sciences of electric powertrains, and therefore are relegated to teaching or using pattern failure diagnostics. Also, most diagnostic techniques that are being instructed in the Aftermarket would uncover only a small percentage of all possible failure modes of an EM. Additionally, my observation of how the Aftermarket and OEMs have instructed technicians in how to identify the small percentage of the EM failure modes has been cursory, at best. Currently, technicians rely heavily on pattern (recognition) failures of systems as a method of identifying the root cause of traditional (ICE) system failures. Unfortunately, EM powertrain mechanical, electrical, and magnetic technologies are iterating so quickly that, pattern failures would be relegated to a less effective diagnostic approach. Without a firm technical foundation in EM technology, analysis and diagnostics will be a literal uphill battle for a technician. Learning EM analysis and diagnostic techniques requires significant training and experience, of which are a challenge for even seasoned diagnosticians, unless the analysis and testing equipment can scrub electrical and magnetic data to make the job of analysis and diagnostics an easier task. Automotive technicians are already overwhelmed with an immense number of courses they attend annually, just to stay current with traditional internal combustion engine (ICE) technologies. And, since ICE technology comprises the majority of the daily interaction for a technician, it is an onerous task for them (and the business owner) to justify allocating significant training hours to learn electric powertrain systems. However, the automotive market has reached an apex. The volume of Electrified Vehicle products in the market that are nearing or out of their warranty period are beginning to hit significant numbers. Therefore, these volumes can no longer be ignored, especially by the automotive Aftermarket. In summary, the automotive service field has reached a state that it can no longer ignore Electrified Vehicle or EM systems, whether they realize it or not!
Diagnostic “Next Steps” For Technicians and Instructors
The automotive service market is currently experiencing a highly transitional time in history. We are witnessing the changing of the guard, as the automotive industry is experiencing the change of ICE powertrains to electrically based powertrain systems. This means that automotive technicians must continue to service current technology while learn and gain experience in the new electric powertrain systems. Since there is no legacy knowledge (i.e., ability to leverage previous knowledge and experience) and minimal technology transfer (current technology has limited use in the new system) from ICE to electric powertrains, the learning horizon is steep and long. The result is that, technicians will need significant support, when analyzing and diagnosing the new electric powertrain systems. Moreover, there is a need in the field to not only analyze and diagnose electric powertrain systems but, also confirm (or not) a diagnostic to ensure that the correct component needs to be repaired or replaced. This is a critical point, as many of the electric powertrain components can register several thousand dollars or more. In summary, automotive technicians will need to rely on testing and analysis that can quickly knit together all the elements necessary to test the electrical and magnetic aspects of an EM and provide streamlined test results and conclusions.
EM Analysis and Diagnostics: A Case Study
Determining electric transaxle or transmission state-of-health (SOH) or, confirming that a catastrophic event has occurred is becoming a more important aspect of the aftermarket service industry and those that analyze, diagnose, and service electric powertrains. As the aftermarket continues to become more of an option to hybrid owners for service, it also becomes more important than ever to ensure that determining SOH or, for confirming an electric motor-generator unit (MGU) has reached its end-of-life (EOL) becomes a repeatable and reliable process. For example, as engine compression, cylinder leak-down, and rpm balance, etc., can change (deteriorate) with time or mileage (aging) resulting in the EOL phase of the product, an MGU can also experience aging effects that will ultimately result in EOL. However, as the calendar time or mileage (aging) that an engine fails can vary dramatically and can be dependent upon many factors (drive cycle, geographic location, terrain, maintenance history, etc.) MGU aging also can also be affected by numerous factors that can (statistically) help determine the general EOL expectations. To garner data quickly, there is no better method that to test electric powertrains that have been recently removed from vehicles and compile this data to form a case study and a method to convey the importance of electric powertrain testing. My experiences in developing diagnostics, testing, and servicing electric drive and battery pack systems rarely is there an opportunity to test MGUs of the same type in the same location that, have a wide range of mileage and chronological ages and, can be tested in a single day. Therefore, this case study will utilize data from 20 Toyota Prius hybrid vehicle electric transaxles that utilize the same drive motor and generator. This electric transaxle has two MGUs: one drive motor (MG2) and one generator (MG1).
Case Study Testing Background Information
The following information serves as background information on the population of Toyota Prius transaxle MGUs that were tested as part of this case study:
• Test Location: Midwest used part business that specializes in hybrid electric vehicle components
• Toyota Prius Transaxle Type: Generation II (2004 – 2009)
• All transaxles tested had been removed from vehicle and stored in warehouse on pallets (note: The MGUs could have been tested with transaxle installed in vehicle or out of vehicle without any change in the testing data)
• Number of Transaxles in test population: 20
• Mileage ranges of test population: 28k – 148k
• Model Year ranges of test population: 2004 – 2009
• MGUs tested: MG1 and MG2
• Number of tests on each MGU to acquire data: One (1)
• Testing temperature: 5.5°C (42°F)
• Humidity: 58%
Case Study Test Instrumentation and Data Acquisition
• MS Excel – for entering/compiling test data and calculating statistical values
• All Test Pro 33EV (AT33EV) – Motor Circuit Analysis tool to acquire motor test data
• Testing Standards Requirements: Institute of Electrical and Electronic Engineers (IEEE) 56, 118 and 120 cover Motor Circuit Analysis testing methods, including how data is collected by instrumentation; IEEE 1415-2006, “Guide for IM Maintenance Testing and Failure Analysis”; IEEE 43-2000, “Recommended Practice for Testing Insulation”
• Rationale for instrument selection: The AT33EV scored the highest of five (5) MGU testing methodologies in a General Motors (GM) internal study that my team performed in 2011 to determine the prospect of MGU test instrument prognostic and testing capabilities. It also scored the highest in a study performed by an external electric motor testing supplier for GM, when the study was replicated to ensure repeatability of test results and instrument performance. Therefore, the AT33EV is a superior test instrument for performing 3-phase EM testing and SOH analysis. One of the primary advantages of the AT33EV tool is its capability of testing an EM rotor without the requirement of rotation. In summary, the EM can be completely tested statically. For the technician, this means that testing can be accomplished with the High Voltage system disabled and no road testing is required – all testing can be accomplished in the service bay.
• Instrument testing parameters acquired by instrument to determine MGU SOH: direct current (dc) Resistance (milliohms), Inductance, Impedance, Capacitance, Phase Angle, Current-Frequency Ratio, Dissipation Factor (contamination), and Insulation Resistance.
• Test results provided by the AT33EV instrument: o Phase winding dc resistance expressed in Ohms of Resistance – this data will be utilized to test for internal motor connections (i.e., corrosion, loose crimp connections, etc.). The dc resistance can also be used to indicate very severe internal coil (copper-to-copper) shorting or more severe phase-to-phase shorting (intra or inter phase winding failures). The dc resistance test is ineffective in identifying less invasive copper to copper shorting and will not assist in determining winding/stator slot aging.
• Insulation Resistance (IR) Testing expressed in Ohms of Resistance – the IR test is observed and compared to the elapsed time to achieve its highest resistance level to determine the insulation to ground resistance barrier.
• Dissipation Factor (DF) – expressed in percentage (derived from phase angle and capacitance measurements) is the measure of the dielectric (insulating) losses in an electrical insulating material in an alternating (current) field and the resulting energy dissipated as heat. DF is used as a means of measuring changes in MGU phase winding wire coating (dielectric varnish or enamel) quality state, wire-to-wire and phase-to-phase dielectric quality state, and stator slot liner insulation (dielectric) quality state to identify any insulating losses due to contamination and/or deterioration (aging). Contamination is/can be, a cumulative effect and is derived from micro elements of aluminum, steel, friction material, oil contaminants, plastics, moisture, etc. that provides a medium in which energy can transfer between phase wires, phase windings, between Phase windings and stator slot liner insulation, or between phase winding wires the slot liner insulation and MGU back-iron (i.e., stator lamination stack) that is electrically common with the vehicle chassis. This results in weakened/aged phase winding coating and/or slot insulator (dielectric) materials. Since a (final) catastrophic failure of an MGU can be the result of cumulative contamination during its service life, DF test data results are an important prognostic/diagnostic metric to the user to assist in determining MGU insulation SOH.
• Test Value Static (TVS) – a dimensionless number comprised of using a sub-set of the aforementioned instrument testing parameters of Inductance, Impedance (AC Resistance), Phase Angle, and Current-Frequency Ratio and scrubbing the resulting metrics with a complex algorithmic analysis. The 3-Phase winding parameter test data is then calculated by software algorithms that provide a resulting numerical value to the user for determining 3-Phase MGU stator and rotor electrical and magnetic performance. The user compares the dimensionless number to a reference number (numbers provided with the tester) for determining numerically how far the tested MGU data has drifted (or not) from new MGU test data of the same type or generation of transmission. The TVS value also eliminates the need for rotating the MGU to test 3-Phase stator windings, rotor magnets or rotor bars, and shorting rings, etc.
• MGU sub-system testing: AT33EV is capable of testing MGU rotor and stator SOH without rotating (spinning) the rotor (whether permanent magnet or induction EM)
• Connection of AT33EV to MGU cables was accomplished by using three (3) 0.375” diameter pure copper adapters with resistance in the low micro-Ohm range, knurled surfaces, and external threads (two adapters 3” in length and one adapter 4” in length) to permit repeatable instrumentation connection to MGU cables.
Case Study Data Presentation
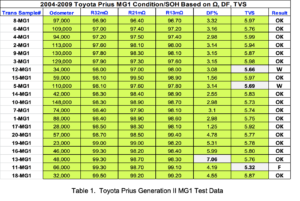
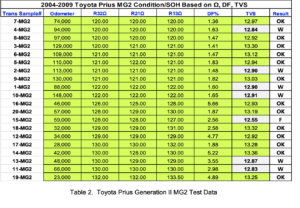
The MGU test data is presented in Table 1 & Table 2. Table 1 provides test data for transaxle MG1 (generator) and Table 2 provides test results on transaxle MG2 (drive motor). The table columns provide the following data (from left to right):
• Transmission sample number
• Vehicle Odometer reading from which transmission was removed
• Resistance 3-2 / 2-1 / 1-3: Resistance values when measuring Phases 3 to 2, 2 to 1, and then 1 to 3. The results of the resistance test are the comparison of the phase winding values to determine the overall resistance balance. The Institute of Electrical and Electronic Engineers (IEEE) Standards Document 1415-2006 states “the three (resistance) values are compared – all readings should be within 3% – 5% of the average of the three readings.” The standard values ensure that there is electrical dc (resistance) and phase current balance between all the MGU phase windings.
• DF% (Dissipation Factor) – Is a number derived from AT33EV software algorithms that provide resulting contamination test data in a percentage (%) format for the user. The data utilized to determine MGU DF is capacitance (the primary element for DF testing), Inductance, Impedance, phase angle, and current-to-frequency ratio as additional electrical elements used by the software to scrub the data. In the data, DF is presented in percentage and capacitance units (%). However, to simplify data reporting in this article percentages will be utilized in three ranges:
o ≤ 6% = Good (OK) – contamination within acceptable limits
o 6% – 10% = Warning (W) – contamination is high but, not out of limits
o ≥ 10% = Failed/Failure (F) – contamination is excessive, out of limits and could also be conditions that are present to cause a more serious failure mode
MGU winding contamination testing is covered in IEEE Standard 43-2000. IEEE 56, 118 and 120 cover Motor Circuit Analysis testing methods, including how data is collected by instrumentation.
• TVS (Test Value Static) – The TVS value permits testing of MGUs by comparing the test data to a reference (new) unit. By utilizing a qualified reference number any MGU SOH can be determined by using this comparison method. Specially, the TVS value can assist in determining the level of MGU aging (deterioration) of windings, stator slot insulation, rotor/stator magnetic condition, etc., or if the unit it has already failed. The key concept of using the TVS metric is being able to test a transaxle/transmission on the vehicle whether uses direct connection to the final drive, single or multiple planetary gear sets or, internal hydraulic clutch systems, etc. However, TVS data will not determine if a 3-Phase MGU problem is the stator or rotor. It can only determine whether there is an electrical or magnetic unbalance in the rotor or stator.
• TVS data results are reported as follows:
o ≤ 3% = OK – Good Stator and Rotor balance
o ≥ 3% but ≤ 5% = WARNING (W) that Stator or Rotor is beginning to become electrically or magnetically out of balance
o ≤ 5% = FAILURE (F) – Stator or Rotor electrical or magnetic properties out of balance and Failed to stay within the testing range. Failure range could also be conditions that are present to cause a more serious failure mode
In automotive systems, it is irrelevant whether the problem is the rotor or stator because, the transaxle/transmission must be disassembled in the vehicle or removed from the vehicle. In either case, the rotor and stator are removed and a new or known good stator and rotor assembly can be used to replace units that have failed testing or indicate data consistent with advanced aging. By replacing both the stator and rotor this would alleviate a possible misdiagnosis or more costly testing.
Case Study Data and Results Discussion
There was a total of 20 Generation II (2004-2009) electric transaxles as part of this study. Although not reported in the data (but noted on the data pages), each transaxle was tested for insulation resistance (IR) at 500Vdc. There were zero (0) transaxles that failed the IR test. However, two of the transaxles (sample 12 & 16) were slow to achieve the maximum 500Vdc IR level @ > 10 seconds) which, from testing experience, indicates the very initial onset of insulation leakage and a weakness in the MGU winding insulation or stator slot insulation materials. As the windings continue to age, the time to achieve the maximum IR level will increase significantly (i.e., 45 seconds – more than 1 minute), due to energy leakage between the winding, slot liner, and stator laminations (back iron). This type of data result will eventually evolve into a MGU failure but, predicting time to failure is not in the scope of this article. However, there are quality statistical methods available (such as Weibull analysis or using Reliability statistics) that can assist in predicting time to failure of the MGU based on the results of electrical test properties, operating environment, etc.
Odometer Data
The odometer data in this case study is very wide and has been rounded to the nearest 1000 miles for ease of reporting. The transaxle with the lowest odometer data point is 23,000 miles and the highest data point of 148,000 miles.
Phase Resistance Measurement Data
Phase resistance data is reported in units of dc milliohms (mOhms). Transaxle sample 8 reported the lowest resistances of 96.40 – 96.90 mOhms. Transaxle samples 3, 4, 7, and 8 reported the lowest resistances for MG2 of 120.00 – 121.00 mOhms. All transaxle sample phase resistance measurements were < 3% resistance variation for phase resistance balance and, therefore, were within the IEEE 1415 – 2006 standard for dc resistance balanced electric machines.
Dissipation Factor Measurement Data
Dissipation Factor % data indicates that transaxle MG1 sample 13 was the only unit not scoring in the normal range with 7.06% (WARNING range). Transaxle MG1 sample 16 data at 5.99% nearly placed it in the WARNING category with sample 13. None of the Transaxle MG2 unit data resulted in a DF% WARNING or FAILURE. However, Transaxle sample 16 DF% of 5.66 is within the confines of acceptable test but, is on the border of WARNING data. Both MG1 and MG2 data for sample 16 nearly place it in the WARNING data category for both MGUs.
Test Value Static Measurement Data
The TVS (dimensionless number) measurement is the most complex measurement data numerical value to report. The target TVS reference value for a Generation II MG1 and MG2 it is:
• MG1 = 5.80
• MG2 = 13.30
Data acquired for the MG1 transaxle samples indicated that samples 12 and 5 were in a WARNING state (≥ 3% but ≤ 5% variance from the reference data target), while sample 11 indicated a FAILED state (≥ 5% variance from the reference data target). Data acquired for the MG2 transaxle samples indicated that sample 1,2,4,10,11 and 13 were in a WARNING state (≥ 3% but ≤ 5% variance from the reference data target), while sample 15 indicated a FAILED state (≥ 5% variance from the reference data target).
Case Study Conclusions
Although this case study involves a small sample size of 20 the data is consistent with testing that has been completed on hundreds of MGUs (whether Toyota product or their competitors). It is understood that, if there was a Generation II vehicle population in the field of ≈1.5M vehicles, the sample size necessary to provide a 95% data confidence (with +/- 3% Confidence Interval) level is ≈1100 transaxles.
The sample size in this study is far from the number necessary to attain a reliable statistical modeling of 2004-2009 MG1 and MG2 MGU electric machines. A large enough statistical population pool (sample size) coupled with a high confidence level and confidence interval to achieve statistical numbers that are reliable to drive a statistical conclusion were outside of this case study scope. However, the preponderance of the testing evidence from this case study (and others like it) have been consistent with other case study results for providing prognostic and diagnostic value to field technicians in determining the SOH of an MGU prior to a catastrophic failure.
Comparison of Data Types – based on the data provided in this case study, it can be concluded that winding resistance data does not trend (or track) other MGU SOH failure modes. All phase resistance testing on the MGUs in this case study indicated that there was balance between all the MGU phases and each complied with the IEEE 1415-2006 standard. The DF data acquired from each of the MGUs did not trend or track with dc resistance testing data nor did it trend to TVS data. Therefore, an MGU can contain balanced phase resistances, DF% data that is within the tolerance bands but, fail TVS testing. This testing complies with IEEE 56, 118 and 120 covering Motor Circuit Analysis testing methods, including how data is collected by instrumentation. Also, based on the case study data, it is possible to contain balanced phase resistances, TVS data that is within the tolerance band but, acquire warning levels for the DF%. This testing complies with MGU winding contamination testing contained in IEEE Standard 43-2000.
In summary, resistance data, DF% data, and TVS data are decoupled in determining the SOH of an MGU. By using fundamental electrical engineering principles combined with advanced math and software algorithms to scrub the data a total picture of MGU SOH or the confirmation of a catastrophic failure are possible. This is good news for technicians in the field because, in the past, many of the MGU operational/performance problems, winding or slot insulation aging measurement or, trying to identify difficult intermittent condition has been unreliable. Unreliable diagnostic techniques such as using only a MilliOhmmeter, use of a MilliOhmmeter and IR, or using a combination of a MilliOhmmeter, IR, and impedance meter are unable to detect the subtle changes in phase winding or stator slot insulation and, therefore, cannot detect the onset of electrical or insulation failure modes. These methods may be acceptable to identify a narrow band of failure modes or confirm a catastrophic condition but, none are able to deliver advanced MGU winding and slot liner SOH testing.
Summary
I hope you have enjoyed this case study and that it has provided you with more insight into how MGUs can be tested for a wide range of SOH and failure modes. The testing of the electric powertrain should become a standard inspection metric for any OEM or Aftermarket service business. As the automotive industry continues to move from ICE based powertrains to an electric powertrain economy, it is vital that automotive technicians understand how testing and analysis should be performed and the failure modes that can be identified with the analysis. It will also be the responsibility of the service business to inform and educate the customer on how electric powertrains change the inspection and servicing of the vehicle. Currently, few service businesses educate the consumer on electric powertrain SOH inspections, and this will need to become mainstream soon to ensure high levels of Customer Relations Management (CRM). The periodic testing of the EMs is an important element of determining the SOH of the electric powertrain and all businesses servicing hybrid and electric vehicles should make it a standard practice of offering this service to the electrified vehicle owner. The vehicle customer won’t know about periodic EM SOH analysis until they are educated, by you. What a great segway for a service business to create new services to generate revenue, while offering a solid service for the customer!
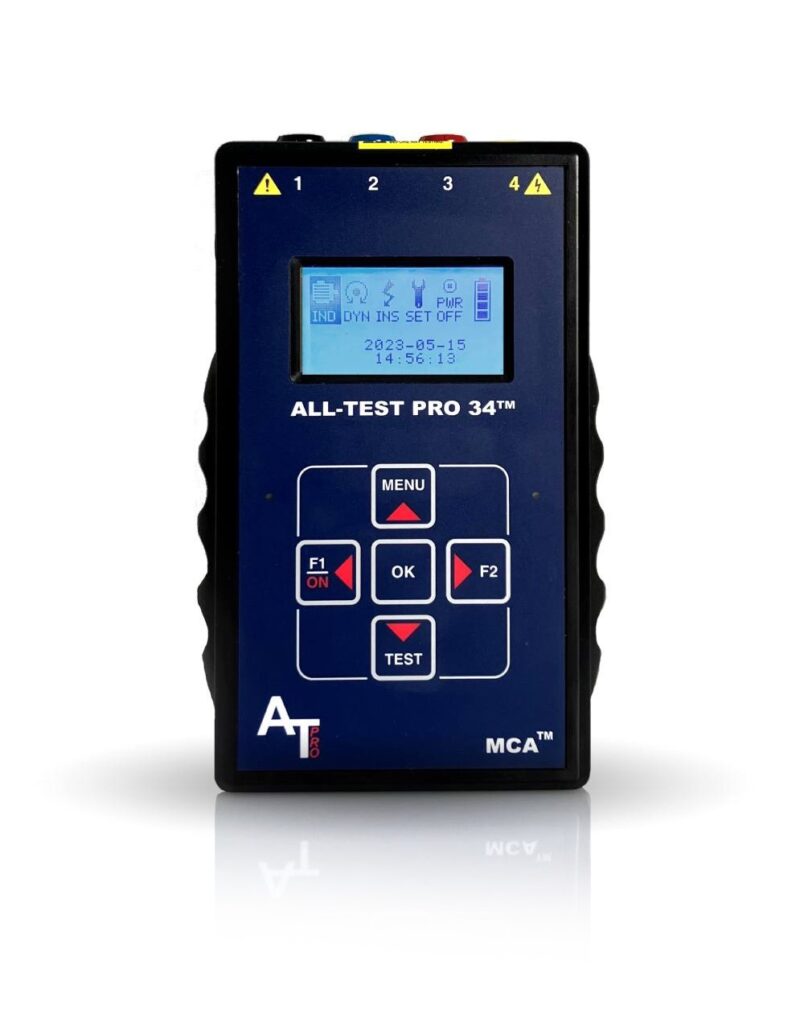
AT34™
Analyze and trend motor component integrity for ground faults, internal winding faults, open connections, and contamination – all with one hand-held device.

PVT-Hybrid Seminar MCA Level 1 – 08/04/2026-08/06/2026
8:30 am - 5:00 pm PLEASE CONTACT [email protected] AND MENTION REF#125-13896 FOR MORE INFORMATION. First Name * E-mail * Company Phone* Product of Interest* —Please choose an option—AT34EV™AT34™AT7™AT7™ PROFESSIONALATPOL III™MDIII™ALL-SAFE [...]
PVT-Hybrid Seminar ESA Level 1 – 08/11/2026-08/13/2026
8:30am-5:00pm EST PLEASE CONTACT [email protected] AND MENTION REF#125-13889 FOR MORE INFORMATION. First Name * E-mail * Company Phone* Product of Interest* —Please choose an option—AT34EV™AT34™AT7™AT7™ PROFESSIONALATPOL III™MDIII™ALL-SAFE PRO®AccessoriesSoftwareTechnical Support ConsultingOther [...]