电机轴承机械和电气振动测试
Preface
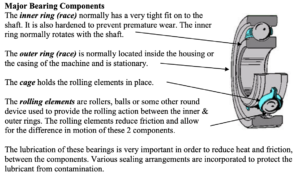
Most rotating equipment relies on rolling element bearings (REBs) to continue operating successfully. The function of rolling element bearings is to bear the load on the shaft, internally position the shaft, and separate rotating parts from non-rotating parts.
Identifying rolling element bearing failures before they disrupt operation or affect product quality is the foundation of most predictive maintenance programs. By regularly investigating and evaluating equipment operating results, bearing failures can be detected before they escalate into catastrophic failures.
For many years, these investigations have typically been conducted reliably using mechanical vibration analysis (MVA). Currently, several methods are available for identifying failures in rolling element bearings. This paper will attempt to determine these methods, ranging from mechanical vibration analysis to electrical signal analysis (ESA).
Introduction
This article describes the four failure stages that most rolling element bearings undergo during typical fatigue failure. The report also discusses how vibration analysis, signal envelope, ultrasonic testing, and electrical characterization can be used to identify the failure stages of rolling bearings.
Rolling bearings are the most commonly used type in industry due to their relatively low cost and high reliability. However, because of their close clearance and highly polished surfaces, bearing failures are not uncommon. Correcting these failures almost always involves completely replacing the faulty bearing.
Bearing manufacturers provide very detailed maintenance, lubrication, and operating procedures to maximize the lifespan of these critical machine components. Following these practices can extend bearing life. Furthermore, “precision maintenance” practices have proven that extending bearing life is indeed possible. Compared to the past, precision maintenance requires very little additional work and can extend bearing life by 5 to 10 times.
However, these bearings can indeed fail due to operating environment, imprecision tolerances, assembly errors, or even the operation of the equipment itself. If the failure is detected before complete failure, the damage and repairs are usually minor, limited to replacing the bearing itself.
The end result is that one or more major bearing components fail due to fatigue.
Causes of bearing failure
According to an estimate by a major bearing manufacturer, approximately 16% of bearing failures are caused by improper handling. This is due to improper storage, transportation, or installation. The remaining 84% of rolling bearings are installed without defects. At this stage, there are no signs of bearing failure. If fault indicators appear during the initial operation of the bearing, it is usually due to bearing fit or assembly problems.
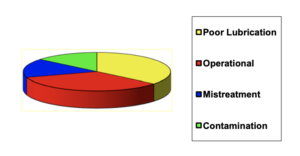
36% of REB failures are caused by poor lubrication, over-lubrication, insufficient lubrication, incorrect lubricant, mixed lubricant, or a lubricating oil film that is too thin, usually due to excessive shaft movement (vibration).
34% of REB replacements are due to operation, imbalance, or misalignment. In some cases, bearing replacements are due to other maintenance requirements, such as preventative maintenance programs.
The final 14% failed due to pollution.
Replace bearing
The main question associated with rolling element bearing failure is: “When should the bearing be replaced?”
This is a decision only the factory can make. Will the failure affect product quality? Will it affect factory operations? What is the availability of replacement bearings? To more accurately assess the condition of the bearings and determine the optimal time to replace them, it is crucial to understand the various stages of bearing failure.
Bearing failure stage
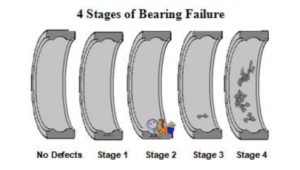
To better understand bearing failure, a major bearing manufacturer conducted a study on the causes of bearing failure. Their research showed that rolling element bearings are defect-free for approximately 80% of their service life. When failure does occur, there are generally four distinct stages of failure.
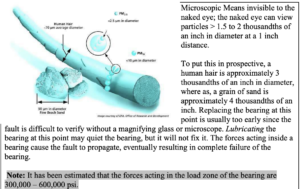
Stage 1: Rolling element bearing failure typically occurs below the surface. They usually begin at a depth of 4 to 5/1000 of an inch (0.1 to 0.125 mm) below the raceway surface. At this stage, the estimated remaining bearing life is 10% to 20%.
Stage 2: As the failure progresses, tiny pits (< 40 micrometers) will appear on the surface of the faulty component. This is considered the second stage, and the bearing life is estimated to be 5% to 10% remaining.
Stage 3: The failure progresses further, leading to initial spalling, cracking, and/or flaking, which is typically associated with rolling element bearing failure. Bearing life remains at 1 to 5%.
Stage 4: When multiple cracks, excessive spalling, or flaking occur, this is the fourth and final stage of bearing failure. Typically, the rolling elements begin to deform, and the cage may disintegrate or break. The bearing has 1% to 1 revolution remaining.
Most repair technicians choose to replace the bearing at stage 3. Although the fault is obvious, the damage is still confined to the bearing itself. In stage 1, it is almost impossible to identify the defect because it is beneath the surface. In stage 2, the defect is not visible to the naked eye and requires magnifying equipment such as a magnifying glass, or even a microscope, to identify it.
If the bearing reaches stage 4, the machine should be stopped immediately and the bearing replaced. Continuing to operate the machine will eventually lead to complete bearing failure. This type of failure will cause machine downtime and catastrophic damage, often resulting in excessive damage to the machine.
Why is predictive maintenance necessary for rolling element bearing failures?
Predictive maintenance planning is based on research showing that 89% of failures occur randomly, and 68% occur immediately after installation or repair. Generally, this means that by performing routine preventative maintenance checks and tasks, the probability of failure actually increases.
Effective predictive maintenance plans use the machine’s operating status to determine when maintenance is needed. The most effective plans identify the three phases of predictive maintenance: detection, analysis, and correction.
Detection Phase: The detection phase is the most crucial because it’s used to identify mechanical failures. Effective predictive maintenance plans can identify failures before they occur, with sufficient remaining time to repair or replace bearings. The idea behind the detection phase is to quickly investigate as many machines as possible. The detection phase can identify any potential bearing failures. The faster these investigations are conducted, the more machines can be investigated, making the plan more effective.
Note: Most mature predictive maintenance programs can identify 1% to 2% of new problems in each survey. That is, if 300 machines are surveyed, only 3 to 6 new problems will be found.
Analysis Phase: The analysis phase may require additional testing, or even a different technique, to determine the severity and cause of the failure. This is often the most time-consuming part of a predictive maintenance plan. If insufficient data is collected during the detection phase for accurate analysis, valuable time is wasted during the detection process. This effectively reduces the number of machines that can be surveyed or increases the manpower required to perform the task. This reduces the effectiveness of the PdM plan. In other words, the philosophy of the detection phase is to quickly survey as many machines as possible.
Correction Phase: The correction phase requires replacing or repairing the faulty component and verifying the correction results. This is also the ideal time to correct the cause of the fault.
Predictive maintenance instruments
Effective PdM instruments should be portable, lightweight, and capable of repeatable non-destructive testing. Many different technologies and instruments exist to accomplish this crucial process. However, no single measurement method or technology currently offers 100% insight into rolling bearing failures. Furthermore, while many existing technologies are adept at detecting rolling element failures, they have limited ability to identify other faults within the machine assembly.
Electrical Characteristic Analysis
事实证明,在预测性维护计划中非常重要的检测阶段,电气信号分析 (ESA) 是识别轴承初期故障的非常有效的工具。 此外,ESA 还能检测电机系统内无法用机械检测方法检测到的故障。 本报告将尝试在滚动轴承故障分析过程中准确定位ESA。
确定轴承缺陷的严重程度
与大多数其他机械振动故障不同,故障频率处的频谱峰值振幅并不能准确显示轴承故障的严重程度。 光谱峰的振幅会根据缺陷的位置、平衡或对齐条件以及缺陷的大小和类型而变化。 此外,机械信号还可以通过共振进行放大。 在许多情况下,频谱峰值的振幅实际上会随着故障的恶化而减小。
有资料表明,确定滚动轴承故障严重程度的最有效方法是确定故障产生的信号频率。
滚动体轴承故障频率
每个转子和轴承的组合都是一个独特的系统;因此,要精确确定每个轴承故障阶段所产生的频率极为困难。 每个转子轴承系统的独特性不仅在于轴承的几何形状和间隙,还在于轴和轴承以及轴承座之间的机械配合。 轴的直线度或锥度以及轴和轴承座的同心度可能会在早期阶段改变轴承的故障响应频率。
以下是各轴承故障阶段的故障以及各阶段故障产生的频率范围。 我们将关注目前可用的各种测量和信号处理技术,以帮助在每个故障阶段识别这些故障。
第 1 阶段:(剩余寿命为 10 – 20)
承载断层第一阶段发生的地表下开裂会产生 300 至 500 kHz 范围内的低振幅应力波。 事实证明,专用传感器和信号处理技术可以在第一阶段就成功识别故障。 然而,在大多数应用中,这只是故障过程的早期阶段,对轴承内部故障进行物理验证极为困难。
这也是一种需要专业技术的专门技术,回报有限。 据估计,当出现第 1 阶段故障时,轴承大约 80% 的使用寿命已经耗尽。
注:一旦表面下开裂开始,故障就已经开始,轴承的完整性就会受到影响。 从这一点来看,唯一的结果就是轴承完全失效。 请记住,轴承 “不会自行修复”,而且故障总是越来越严重
第 2 阶段:(剩余寿命为 5 – 10%)
随着故障的恶化,表层下的裂纹开始向表面迁移,并在故障部件的表面造成微观点蚀
在第 2 阶段故障的早期阶段,微小凹坑产生的冲击会导致轴承部件以其固有频率振动。 这些自然频率在 30 至 60 千赫范围内。
冲击脉冲监测、尖峰能量和其他超声波技术等专业测量技术依靠振动传感器的固有频率产生共鸣。 在共振状态下操作换能器可将这些极小的缺陷信号放大到可用范围。
共振常常被误解为机械系统的一种特性。
自然频率:所有弹簧系统都有自然频率。 系统的自然频率是系统受到冲击时的振动频率。 一次撞击将导致系统以其固有频率振荡,然后衰减。 冲击力会导致质量块偏转,而弹簧会使其回到原来的位置。 这种振荡的频率由弹簧系统的质量(m)和弹簧(k)关系决定。
如果对频率接近弹簧系统固有频率的弹簧系统施加重复力,那么每次振荡时,力的作用方向将与运动方向相同。 这将导致在对质量施加每个周期的力时,系统运动都会增加。
这种情况通常被称为共振。 共振条件的结果是,所产生的运动将比施加不接近固有频率的力时放大 10 到 15 倍。
随着故障的发展,部件的刚度会减小,从而降低部件的固有频率。 这使得信号频率更接近传感器的固有频率(25 千赫)。 随着故障频率越来越接近固有频率,传感器的输出会进一步增加。 事实证明,这些方法非常有效,当轴承开始出现故障时,这些数值就会发生变化,但机器系统内的其他故障也会导致这些频率的增减。
还开发了其他信号处理技术,如加速包络、ESP 和峰值检测,以便在早期阶段更精确地识别轴承故障。 事实证明,这些方法非常有效,但在检测其他类型故障方面的能力也很有限。
当信号出现在 30 至 60 kHz 频率范围内时,轴承就属于早期第二阶段缺陷。
随着第 2 阶段故障的发展,信号强度会增加。 这种较强的信号会激发系统的固有频率。 系统固有频率包括轴和轴承系统。 系统和轴承固有频率与机器速度无关,但受转子和轴承支撑质量和刚度的影响。 质量的增加导致系统固有频率低于轴承部件的固有频率。 系统固有频率一般在 500 赫兹到 2000 赫兹之间。 信号的强弱取决于旋转轴的平衡或对齐状况,以及故障与传感器之间的位置关系。 在许多情况下,这些信号被掩盖在机器的背景振动中。
电气信号分析 (ESA) 通常能在此阶段识别轴承故障;在某些情况下,ESA 甚至能比某些专业机械技术更早识别故障。
欧空局通常在第 2 阶段就能发现潜在的轴承故障。 ESA 通过定位中心频率周围线路频率(通常为 50 或 60 赫兹)的频谱峰值来识别机器故障。 电流频谱中出现但电压频谱中没有的线路频率边带表明故障来自机器或流程。 在某些情况下,在大多数标准机械监测方法显示出问题之前,这些信号就已经出现在电气特征中了。
该频谱显示轴承故障频率约为 2500 赫兹。 它出现在电流频谱中,但不出现在电压频谱中,这表明能量是从电机系统或被驱动机器中增加的。
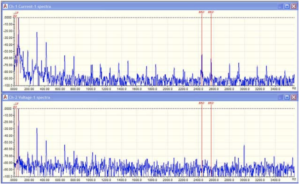
当信号出现在 500 到 2000 Hz 范围内时,轴承就属于第二阶段后期缺陷。
第 3 阶段:(1- 5%剩余寿命)
随着轴承故障的恶化,故障部件表面会出现裂纹、剥落、剥落、孔洞或其他缺陷。 这些都是大多数维修人员所熟悉的缺陷。 这是在目测轴承时首先能目测到缺陷的情况。 在这个阶段,可以听到轴承发出噪音。
这些故障会导致信号强度足够强,从而在振动频谱中产生通常称为轴承缺陷频率 (BDF) 的信号。 这是在故障范围内,通过振动标准速度或加速度测量可首次确定轴承缺陷的点。 如前所述,”如果出现这些信号,说明轴承有缺陷”。
轴承缺陷频率取决于轴承的几何形状。 其中,如果问题出现在外侧滚道上,则缺陷会产生信号 BPFI 来自内侧滚道 BSF 是滚动体频率 FTF 是基本列车频率;这是保持架组件的旋转速度。
轴承缺陷频率的产生
当轴旋转时,会使内滚道与轴一起旋转,保持架组件(FTF)以小于轴旋转速度的速度绕轴旋转。
当外滚道出现故障时,每次滚动体在缺陷上滚动时都会产生冲击。 缺陷造成的冲击将导致轴承以轴承部件的固有频率(30 至 60 kHz)或轴承系统的固有频率(500 至 2000 Hz)振动。
在滚动轴承分析中,撞击频率被称为轴承重复率,或更常见的轴承缺陷频率 BDF。 外滚道频率通常称为 BPFO,即滚珠通过频率(Ball Pass Frequency Outer race)。 信号的振幅不仅取决于缺陷的大小,还取决于缺陷与传感器位置的关系、轴承配合的松紧度以及机器的平衡和/或校准状况。 换句话说,与平衡状况较好的机器相比,不平衡程度较高的机器会产生较大的冲击力。
如果故障发生在内滚道上,它就会随着轴的旋转在负载区内滚进滚出。 当冲击发生在负载区时,信号强度将大于故障发生在负载区对面时的信号强度。 请注意,响应频率将是轴承的固有频率,而冲击频率将是 BPFI 球通过内圈的频率。
冲击振动与强制振动:
强迫振动是指先向一个方向施加力,然后立即向相反方向施加力。 然后不断重复这个循环。 系统对强迫振动的响应是与外加力频率相同的运动。 通过识别作用力的频率,就能确定力的来源。 例如,如果一台机器的振动速度与轴的旋转速度相同,那么就很容易确定振动力的来源是轴。
When a force (such as an impact) is applied, impact vibration is generated, followed by a time interval before the next impact. The vibrational response to the impact force causes the mass to vibrate at its natural frequency. In impact-type vibrations, the frequency of motion does not determine the source of vibration because it vibrates at its natural frequency. To determine the source of the effect, the frequency of the effect must be determined. The spectrum shows the response frequency, not the impact frequency.
Understanding bearing defect frequency
The bearing defect frequency depends on the bearing geometry: Pd is the pitch diameter. The measurement method is to measure from the centerline of one rolling element to the centerline of the opposite rolling element.
Bd represents the diameter of the sphere.
Nb represents the number of rolling elements.
The contact angle (Ø) refers to the relationship between the inner and outer raceways. The contact angle of a deep groove ball bearing is always 0 degrees, while that of a thrust ball bearing is 90 degrees. The contact angles of angular contact ball bearings, self-aligning roller bearings, and similar types of bearings vary depending on the bearing design.
The frequencies generated by these signals depend on the bearing geometry and shaft speed. These expected or (calculated) frequencies are listed in tables published by bearing and instrument manufacturers. These frequencies are very precise, typically accurate to 1/100th of the shaft rotation. That is, BPFO = 4.68 times, BPFI 7.32 times the operating speed.
1) They are usually non-integer multiples of the rotational speed. This is important for distinguishing them from other mechanical failures, which always occur at precise multiples of the operating speed.
2) The calculated defect frequency is usually not accurate. The calculation formula is based on the fact that the rolling element rolls 360 degrees around the axis. However, experience shows that while the rolling element rolls in the load zone, it often slips outside the load zone. Therefore, the calculated frequency will usually differ from the measured frequency. The difference between the actual defect frequency and the calculated frequency is generally between 5% and 10%.
3) If the frequencies of BPFO and BPFI are added together, they will always equal the number of rolling elements. That is, BPFO is 4.68 times, BPFI is 7.32 times, and Nb equals 12. Empirically, BPFO is approximately equal to Nb x 0.4, and BPFI is Nb x 0.6.
4) The amplitude of the signal does not indicate the severity of the bearing failure, but more importantly, it indicates the frequency of the failure.
The BDF frequencies generated in the ESA spectrum are typically the same as those in the mechanical spectrum. However, these frequencies often appear earlier in the ESA spectrum than in the mechanical spectrum. This is because even small changes in the rotor position can cause changes in the motor current. These small changes in rotor position may not cause vibration in the bearing support system. Such vibration requires a vibration measurement system to detect.
When the signal appears at a multiple of BDF, 2 times BDF, or 3 times BDF, the bearing is considered to have an early level 3 defect.
In stage 3, as the defect continues to worsen, the amplitude of the defect frequency will begin to modulate or truncate. This will cause sidebands or harmonics of the BDF to be generated in the spectrum near the BDF.
When sidebands or a series of harmonics appear around the bearing bearing (BDF), the bearing is considered to have a late-stage third-stage defect. Disassembly of the bearing is recommended.
The rules for detecting defects in Stage 3 rolling element bearings using ESA are the same as those for vibration analysis. Most importantly, these are the defect frequencies; if a defect frequency is present, the bearing is defective.
Phase 4: (1% of remaining lifespan – 1 revolution)
As the defects worsen, multiple cracks, spalling holes, or spalling will appear. The rolling elements may deform, and the cage may disintegrate. At this stage, most (if not all) signs of bearing failure will disappear: BDF spectral peaks, sidebands, and harmonics.
However, because the shaft has greater freedom of movement within the bearing, the operating speed (1X) force will increase. Furthermore, the background noise across the entire spectrum may increase because the generated frequencies no longer occur at exactly the same time intervals.
If the previous frequency disappears, or the background noise of the spectrum or the signal increases at 1x operating speed, it is recommended to shut down the machine immediately, as the bearing may fail completely at any time.
The role of electronic signal analysis in detecting rolling element bearing faults
Most rolling element bearing failures can be detected in stage 2 through electrical signal analysis.
ESA uses changes in magnetic flux in the motor’s air gap as a sensor. In many cases, ESA can detect rolling bearing faults as early as the second stage. These faults have been confirmed using the accelerating envelope method. The frequencies in the ESA’s spectrum are the same as those used when the accelerating envelope method is employed.
ESA identifies machine faults by detecting spectral peaks in the line frequencies surrounding the center frequency (typically 50 or 60 Hz). Line frequency sidebands present in the current spectrum but absent in the voltage spectrum indicate a fault originating from the machine or process.
The bearing defect frequency peak appearing in the ESA spectrum will be the same frequency as that in the vibration spectrum. Furthermore, the BDF signal appears in the electronic spectrum at approximately the same time as it appears in the vibration spectrum. In both cases, the bearing exhibits stage 3 failure.
In this ESA current spectrum, the Stage 3 defect appears at BPFI of 35374, with a sideband of 3000 CPM (50 Hz). Near system 70748 CPM ≈ 1179.13 Hz, it also appears with a sideband at twice its BPFI line frequency (50 Hz).
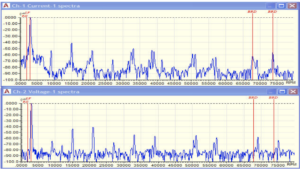
The 50 Hz sideband also has a subsynchronous sideband, indicating that the fault occurred in the later part of the third stage.
Furthermore, note the broad base of the spectral peaks, indicating that the measured frequencies for each sample are not exactly the same, which is also a sign of late-stage Phase 3 failure. This failure was verified by vibration velocity measurements. The frequencies in the vibration spectrum are the same as those in the current spectrum.
Note the peaks in the current spectrum at the top; these peaks are not present in the voltage spectrum below. This indicates a fault originating from the motor or load.
As the defect develops, line-frequency sidebands will appear around BPFO or BPFI.
Summarize
Identifying rolling bearing failures is a critical process for the successful operation of any plant containing rotating equipment. Electrical signal analysis provides the plant with additional tools to not only quickly identify internal motor faults but also detect rolling bearing failures at an early stage.
Electrical Characteristic Analysis (Overview)
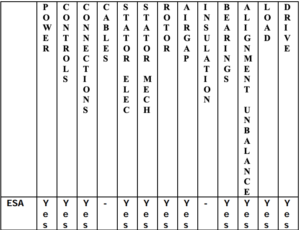
Electrical signal analysis (ESA) is an online testing method that captures voltage and current waveforms while the motor system is running, and then performs spectral analysis using provided software via Fast Fourier Transform (FFT). This FFT can detect faults related to the input power supply, control circuitry, the motor itself, and the drive load, and can perform trend analysis to achieve condition-based/predictive maintenance.
ESA testing provides valuable information for AC induction and DC motors, generators, wound-rotor motors, synchronous motors, machine tool motors, and more. Since ESA may be unfamiliar to many, the following diagram illustrates the ESA assessment of key components within an AC induction motor system.
CV
William Kruger has been working in predictive maintenance for nearly 40 years. He graduated from the U.S. Naval Nuclear Power School and holds a bachelor’s degree from San Diego State University. His first encounter with predictive maintenance was while operating a vibration program on an SSBN submarine. He worked for San Diego Gas & Electric for 10 years, where he initiated the predictive maintenance program. Afterward, he worked as an applications engineer at Spectral Dynamics’ DYMAC division.
For the past 20 years, Mr. Kruger has focused on training in the field of predictive maintenance. He was a senior lecturer at Update International. Mr. Kruger has conducted training courses on six continents and is renowned for his practical mechanical analysis methods and his ability to explain complex technical materials in an easy-to-understand manner through principles and demonstrations.
Mr. Kruger is currently the Technical Support and Training Manager at ALL-TEST Pro. He has authored numerous technical papers and presented at various conferences, including the Vibration Institute, EPRI, the Canadian Pulp and Paper Expo, and the International Maintenance Conference. He is a member of ASME, the Vibration Society, ANST, the Institute of Electrical and Electronics Engineers, and many other professional organizations.