Electrical Signature Analysis vs Vibration Analysis
Abstract:
It is well known that rotating machinery exhibit specific characteristics when faults cause the geometric centerline of the shaft to periodically move. For more than 70 years, Machinery Vibration Analysis (MVA) has been used to identify and determine the severity of these faults and is an integral part of many successful plant reliability programs. Recent experience and research has proven that many of these same faults can be identified using Electrical Signature Analysis (ESA). ESA also evaluates and identifies faults with power coming into the plant, the power supplied to the motor, as well as electrical and mechanical faults within the motor system. Moreover, ESA is emerging as a very important technology within some Electrical Reliability programs. Some plants are using it as the main detection tool to identify both electrical and mechanical problems on machines, which are driven by electric motors. This paper will examine both of these dynamic Predictive Maintenance Program (PdM) technologies and identify the strengths and weaknesses of each technology and try to determine where these two technologies best fit into a Reliability Program.
Key words: Demod Spectrum; Detection Phase; Electrical Signature Analysis; FFT Analysis; Machinery Vibration; Motor System Faults; Rotor Electrical; Stator Electrical.
Maintenance Philosophies:
Companies with a large population of capital equipment either provide a service or produce a product with this highly capital-intensive equipment. In order to protect this equipment and keep it in operating order, it is necessary to perform maintenance. Pressure, over time, continues for companies to produce higher quality products at a lower cost, while trying to gain higher profits. Service providers are also subjected to providing more reliable services at a much lower cost. This requires the maintenance department to not only properly maintain this equipment, but to do it at a lower cost.
These pressures have led to the evolution of maintenance practices or philosophies. Early maintenance practices were known as “run till failure” (RTF), but industry pressure has evolved these practices to precision (or proactive) maintenance.
A brief review of these maintenance philosophies and costs might explain the need for the evolution of these practices. These costs of RTF, Preventive and Predictive maintenance were extracted from an article published in the late 1970’s from a refinery in the south US that tracked and published their maintenance costs through this evolution. The costs of Precision were added and adjusted for cost of living based on the results of many plants implementing Precision Maintenance in the early 1990’s.
Run Till Failure ($17 -18/HP/YR):
This approach requires little involvement other than turning the machine on and off and supplying a product. In this manner the machines continue to operate without interruption. However, when failure does occur they are usually very severe and result in failure to the original component as well as damage to other components of that machine, such as connected machines and the foundation. This additional harm often results in damage to components, which usually do not fail, and are seldom found in the in-plant’s spares.
Repairing or replacing these components require manufacturing them in-house or purchasing them from the original manufacturer at premium cost and long lead times, thus resulting in lengthy shutdowns. Therefore, RTF results in the most expensive method of maintaining plant equipment. This is without considering the lost production costs. These costs are very hard to predict and measure, but experience has shown that increased maintenance costs usually result in additional downtime.
Preventive Maintenance ($11-12/HP/YR):
This maintenance philosophy is based on the assumption that mechanical equipment will wear and fail over time. Machine designers and manufacturers, research and study their machines to determine the recommended maintenance requirements and inspection intervals for their machinery. The recommended maintenance and inspections are then performed at these predetermined time intervals.
However, in the mid 1980’s a reliability study written by Nolan and Heap, determined that machines do not fail on time. They fail either too early or too late. Machines that fail too early have the same problems and costs associated with the “run till failure” maintenance, whereas machines that fail too late result in many hours of unnecessary maintenance and premature replacement of components. More importantly this study determined that only about 11% of machine failures were age related and 89% were more random in nature. This basically means that preventive maintenance is effective for 11% of the failures, but ineffective for 89%. They also reported that 68% of failures occur shortly after installation or repair of a machine, this period is often referred to as the break-in period, and the more complex the machine is the more likely the machine is to fail during the break-in period.
Predictive Maintenance ($7-8/HP/YR):
An additional reduction in maintenance costs was achieved through the use of condition monitoring. In the early 1960’s companies recognized that when rotating equipment began to fail, its operating conditions would change. By routinely monitoring these operating conditions, an advanced warning of these changes provides sufficient time to remove the machine from operation, before catastrophic failure occurs.
This maintenance philosophy has escalated since the early 1980’s with the introduction of microprocessor based data-collectors. A machine’s operating characteristics such as temperature, pressure, oil condition, vibration and performance can be measured and trended to identify changes. In some cases comparing these measurements to predetermined values can quickly identify the condition of the machine without trending. This led to rapid acceptance and implementation of predictive maintenance programs (PdM). Predictive maintenance uses various machine measurements to identify the machine’s conditions. There are many different PdM technologies and the most successful programs use multiple technologies to provide the most information and consequently the highest probability of identifying a machine with a developing problem.
Many PdM programs are guilty of “Forestry Blindness” (can’t see the forest from the trees). They spend so much time collecting the data, that they do not have time to analyze or they neglect “less critical” machines.
The most successful PdM programs use effective screening. The goal of the detection phase is to identify, “bad machines”. Once a bad machine is identified then additional measurements or technologies may be used to determine what caused the machine’s condition to change, and then the proper corrective actions are taken in order to place the machine back into good condition. This evolution has led to the establishment of three phases of PdM. The three phases are detection, analysis and correction. Some programs add a fourth phase, which is verification, however I believe that verification is part of the correction phase.
Some of the most common PdM technologies are Machinery Vibration Analysis (MVA), Infra-red Thermography, Ultra-Sonics, Oil Analysis, Motor Circuit Analysis (MCA), and Electrical Signature Analysis (ESA). The common characteristic among the most successful PdM technologies is that they are easy to perform, and provide nondestructive, repeatable measurements.
Detection phase:
This is usually the most important phase and the basis of the whole PdM program. The detection phase involves periodically monitoring the operating characteristics of the selected equipment. These values are trended and inspected for any change. The data collection process should be done quickly and carefully, with the intent of monitoring as many machines as possible. When a change is detected, additional data is then taken for analysis purposes, in order to determine the cause of the machine’s condition change.
In the detection phase the whole purpose is to identify the machines that are failing. This means that as many machines are screened in as short of a period of time, as possible. Most PdM software programs then view the collected data and identify the suspect machines.
Analysis phase:
This phase involves taking additional and perhaps different types of data than the detection phase. This additional data usually requires additional data collection. Since only a few machines, during the detection phase (somewhere between 2% and 3% in a mature program) exhibit any significant change, it is usually more time effective to quickly take the data necessary to identify a change during the detection process, and then go back for a more detailed look once the change is detected.
However, if the plant site is remote or has other access limitations, then taking more detailed data during the detection phase will be justified. Many plants and sites decide to permanently install monitoring systems for these applications.
Correction Phase:
This phase involves correcting and eliminating the problem that triggered the change in condition. This may require cleaning a fan, replacing a bearing or a worn coupling, etc. Acceptable vibration levels or other performance measurement levels determine the exact type of corrections and repairs. Details for correcting and eliminating these problems are located in later sections of this paper.
The data taken during the detection phase is usually insufficient to provide anything other than a preliminary analysis. To conduct a more detailed analysis other types and more involved data needs to be taken. In some cases the machine may need to be operated under different conditions and with multiple technologies. Attempting to analyze a problem using only the detection data results is less than a reliable analysis. If sufficient data is taken during the detection phase for a more accurate analysis, it will slow down the detection process. Most experienced reliability departments have recognized the importance of separating these two steps.
Electrical Reliability:
Most people only consider that electrical reliability ends with the successful delivery of power to the plant. Electrical power is one of the most important raw materials used in industry today. Not only must we have a continuous flow of power, it should also be clean and balanced. Yet, this important commodity is also one of the least inspected raw materials supplied to the plant.
Electricity is required in almost all areas of the plant to provide the driving force that operates most of the equipment that produces the products or provides the services that the plant’s equipment was built to perform. Electricity is a unique product in itself, in that it requires continuous flow, cannot be conveniently stored, and is normally not inspected prior to use.
Power quality may be the cause of a breakdown or failure. The result of poor “power quality” is usually long term and is not always considered as the source of the problem. A motor burns up or a breaker trips, electrical and mechanical inspections are conducted on the motor and the driven machine, then the motor is rebuilt or replaced and the whole process repeats. Additionally, today’s newer machines and equipment have driven the necessity for better Power Quality to increase. Yet, if the power is examined at all, it might be examined at the point where it comes into the plant and not on any routine basis. Nor is it inspected at the point that it is supplied to motor or the equipment itself.
Power is normally generated far from the point of use, the reliability of the original generation is unknown plus it is combined on the grid with many other generators. The power is transported through several different transformers, and many miles of overhead and underground cabling before arriving at the plant. Many of these electrical distribution systems are owned, managed and maintained by several different entities. Once bad or “poor quality” power is placed on the grid it cannot be removed or even rejected by the user.
Many of the generating plants are smaller and privately owned. Work is in progress to try and regulate and standardize power quality and many states have their own specialized standards and regulations. However, generated power does not necessarily stop at the borders of the state, where it is generated.
Even if the power arrives at the plant in “good quality” there are many areas within the motor system that can adversely affect the continued success of operating the plant.
Electric Motor System:
More than the motor itself can affect plant reliability. In fact anything within the motor system can cause a failure of the motor system, which can lead to disruption of the process. An effective detection will screen the machine for potential problems. It is logical that the detection method will screen as much of the motor system with as few measurements as possible. The detection method is also used to identify as many potential failures as possible. When selecting an effective screening method it is also necessary to identify the problems that create failures in the motor system. Once these questions have been answered then it is necessary to identify the possible methods available to screen as many machines in the least amount of time.
The motor system consists of two subsystems: motor/drive subsystem and the mechanical subsystem. The motor/drive subsystem begins with the power coming into the plant, this may include transformers, cabling and switching devices. The incoming power is then supplied to a distribution or Motor Control Center (MCC). The MCC consists of starters, protection devices, such as overloads, variable frequency drives and a variety of other systems that safely transports the power to the motor to be successfully operated and controlled.
An electric motor converts electrical energy into mechanical torque; therefore, the motor has both electrical components and mechanical components. The electrical portion of the motor consists of the stationary component or stator, and the rotating component or rotor.
Stator windings provide a path for current to flow, creating a magnetic field in the stator. The rotor consists of either windings or bars to provide a path for current to flow through the rotor, thus creating a rotor magnetic field. The interaction between the rotor magnetic field and the stator magnetic field creates the mechanical torque. The mechanical subsystem begins with the mechanical portion of the motor. This begins with the shaft, which transfers the torque generated by the interaction of the rotor and stator magnetic fields to the driven machine or the load. Bearings separate the rotating from the non-rotating components, as well as, position the rotor inside the motor. The motor shaft is connected to the load using a coupling device such as direct couplings, belts and pulleys or sometimes even gears.
The driven machine is the portion of the system that performs the work and there are many types of machines that act as the load, such as pumps, fans, compressors, machine tools, robots, valve stems among many other mechanical devices. The final portion of the machine system is the process itself, the machine may shape or cut material, it increases pressure, move air or other types of gases, transport liquids or mix materials. When selecting a detection method it is necessary to survey as many of the components in the system as possible.
Motor/Drive Subsystem:
The types of faults that will occur in the motor/drive subsystem are mostly electrical in nature.
Incoming power faults range from voltage mismatch, non-sinusoidal, and voltage unbalance. These can come directly from the supplier, or shorts in the transformer windings or improper tap settings on the transformers. Nonsinusoidal power can set up negative sequencing harmonics inside the motor, which creates excess heat.
Faults in the control system can range from loose connections of the bus bars or cabling, eroded, corroded or loose contactors, loose fuse connections, or faulty overload relays. Loose connections, and eroded or pitted contactors create a voltage unbalance, a small voltage unbalance applied to the motor can create up to twenty times more current unbalance, which sets up circulating currents creating excess heat in the motor system.
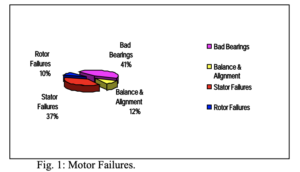
Faults in the motor system can be separated into electrical and mechanical faults. In the mid 1980’s Electric Power Research Institute reported that 53% of motor failures were mechanical in nature (41% bearings, 12% balance and alignment) and 47% Electrical (37% winding and 10% rotor), see fig. 1. Of the winding faults 83% are winding shorts and only 17% are insulation to ground faults. Rotor faults will vary with motor type and construction. However, the most common motor is the squirrel cage rotor induction motor. The common faults with squirrel cage rotors are loose or broken rotor bars, non-concentric rotor, or a thermally sensitive rotor.
Mechanical Subsystem:
Mechanical faults within the motor are basically the same as any other rotating equipment. These faults could include unbalance, misalignment, bent shaft, loose components and worn or defective bearings. Motors are also subject to failures as the result of distortion of either stator or rotor magnetic fields. These faults create mechanical forces that interact with other mechanical forces such as unbalance, misalignment, etc.
Inside the motor, bearings are used to position the rotor and separate the rotating component from the stationary component. Two types of bearings are normally used, rolling element bearings and sleeve or journal bearings.
Coupling faults are dependent on the type of coupling devices. There are many different devices available to connect the motor to the load. Some devices directly connect the motor to the driven machine and these machines run at the same speed and in the same direction. Some devices change speeds or direction or both. Other common coupling devices are belts, pulleys, and gears.
Any of the coupling types can have unbalance, run-outs, and non-square machining or other fit or assembly faults on the rotating components.
Belt and pulley arrangements can have faults created because the pulley is not mounted properly on the shaft, the pulley may have run-out, or the belt may become loose, cracked or frayed. If the coupling device is a gear arrangement, small forces are usually present as the result of the teeth from one gear “meshing” with the other gear. Additional faults occur if one or the other of the gears has run out. Gears are also subject to wear, cracked or broken teeth.
The driven machine or load may also have various different levels of unbalance, mis-alignment or run out that can create rotating forces. Centrifugal machines such as a pump’s fan and even compressors create hydraulic forces that interact between the rotating and non-rotating parts of the machine. These forces cause motion every time one of the impeller vanes or blades passes a stationary component, such as the “cut water” in a pump.
The process itself can create mechanical forces acting upon the machine/motor system. Some of these forces are the result of the machine’s operation. Machines, such as punch presses and stamping machines create forces during normal operation. Processes, such as cavitation and recirculation, can create hydraulic forces in the fluid system. Additional process changes such as change in load can vary the machine’s operating temperatures and pressures, causing alignment changes as the result of differential thermal growth of the respective machines.
Machinery Vibration:
Machinery Vibration Measurements use transducers to measure the mechanical motion of the component or the part of the machine that is vibrating. The transducers convert this mechanical motion into an electrical signal. The transducer is either mounted directly on the component that is moving, or it is mounted to the bearing or other support structure. These sensors measure the mechanical motion of component being observed, which is either the bearing housing or the shaft itself.
As the motion of the component moves towards the sensor; it generates a positive voltage output, when the component moves away from the sensor; it generates a negative voltage output. This allows the sensor to produce an output electrical signal that will duplicate the motion of the moving component. The amount of voltage represents the amount of motion.
Newton’s Second law of motion states that F=ma. This translates into the fact that the amount of motion represents the amount of the force that is being applied to the component. What this means, is that on very large machines, it will take a very large fault to move the mass a measureable amount. Additionally, the type sensor used to make the measurement can affect the output of the sensor.
Vibration Measurements:
There are two types of vibration measurements: relative and absolute motion.
Relative Motion:
The first is a relative measurement, which relates the motion of the measured component to another component. The most common of these measurements is to measure the motion of the shaft inside a journal bearing. This measurement generally uses non-contacting eddy probes, a sensor, which mounts either to or through the bearing itself. These measurements have proven very effective for identifying the path that the shaft is moving inside the bearing and the amount of motion. These measurements are in displacement, either mils (0.001 in) or microns (.000001 m).
The main advantage of these types of sensors is that it is very easy to compare the measured motion and compare it to the internal bearing clearance. A disadvantage is that if the component that the sensor is mounted to is moving then a true measurement of the forces being applied to the shaft cannot be determined. A second disadvantage is that displacement at higher frequencies can be very small, and yet have a large displacement. Consequently, faults at higher frequencies will be buried in the noise floor of the measured signal.
Absolute Motion:
The second measurement of vibration is absolute motion. This measurement uses a sensor that compares its motion to earth. The most common sensors are induction type sensors that produce an output voltage that is proportional to velocity of the motion. The more commonly used sensor is a piezoelectric device that produces electrical charges, which are related to the force applied.
The induction type sensors and the piezoelectric sensors have advantages and disadvantages. The major disadvantage of both of them is that since they measure absolute motion, such as early stages of rolling element bearing defects, cavitation within the pump cavity or hydraulic forces in deep well pumps are not sufficient to move the pedestal or bearing housing.
The second disadvantage is the frequency response of the sensors. The induction sensors are severely limited at both low frequencies and high frequencies, whereas, the piezoelectric sensor will amplify signals at higher frequencies. They both are also subject to linearity changes due to the mounting techniques of the sensor, as well as the direction or location of the sensor.
The forces that these sensors measure are a combination of all the mechanical forces combined at the point of measurement. Since most rotating machinery have many different components and each of these components can contribute any number of repetitive forces to the machine, the measured vibration signal will be a complex signal consisting of many signals.
Machinery Vibration Analysis (MVA):
The process of machinery vibration analysis identifies the frequencies that are present in the machinery vibration and then correlates them to the frequencies of the forces that are created by mechanical and electrical faults.
To determine the frequencies that are present in the measured signal, the analyzer performs a Fast Fourier Transform (FFT) on the signal. This mathematical process converts the collected complex time based signal from the time domain to the frequency domain. The FFT identifies the amplitudes and frequencies that are combined together to make up this complex signal.
Mechanical Faults:
There are numerous charts, tables and papers that describe the frequencies that each of these mechanical faults generate, when these faults are present. Several of these faults generate the same fault frequencies. Faults such as unbalance, misalignment, bent shaft, cracked shaft and an eccentric rotor all are created by faults on the rotor and will generate forces that are related to the shaft rotational speed. In many cases, it is necessary to perform additional measurements or use additional technologies to further define these similar problems.
Other problems such as rolling element bearing defects have frequencies that are dependent on the stage of the defect as well as the geometry of the bearing. One of the problems with rolling element bearing defects is that defects in the early stages generate very low amplitude signals and are difficult to identify in the early stages of a developing fault.
Electrical Faults:
Electric motors operate by the interaction of magnetic fields on the rotor and the stator. If the magnetic field on either the stator or the rotor become unbalanced or distorted, it will create unbalanced electrical forces inside the motor. These forces will cause the rotor to move inside the motor as the rotating magnetic field passes the distorted or unbalanced fields.
Stator Electrical Faults:
The shape of the core is determined by magnetic field. Both the stator core and the rotor are normally designed to be perfectly round.
Unequal air gaps:
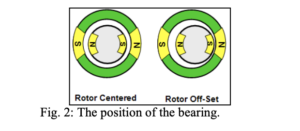
Centering the perfectly round rotor inside a perfectly round stator all magnetic forces will be equal and opposite. However, if the rotor is positioned closer to the stator in any area, then as the magnetic field passes the narrow clearance there will be a stronger attraction, pulling the rotor toward the stator and a weaker attraction on the opposite side of the rotor, to where there is wider clearance. This will create an electrical unbalance and is known as an unequal air gap.
The position of the rotor inside the stator is determined by the position of the bearings (see fig. 2). The bearing is positioned by the machined fits of the bearing housing, end bell and the machine frame. Since the narrow clearances are determined by the position of the rotor, the unequal clearances will always be at the same location inside the air gap and is commonly referred to as static eccentricity.
It has been determined that on a 2000 HP, two pole motor, where the rotor air gap is offset by 10% inside the stator, the electrical forces created will be more than 10 times greater than the centrifugal force created if the rotor is balanced to an ISO balance spec of G 2.5. A balance spec of G2.5 is considered a good balance.
Soft foot is normally associated with misalignment, however, if the motor has an uncorrected soft foot, tightening the hold down bolts will not only reposition the bearing position, creating a possible misalignment, but it will also distort the motor casing (see fig. 3).
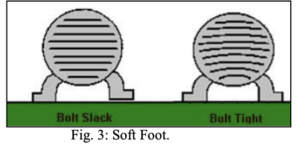
This distorted casing will deform the stator iron, which will then alter the stator magnetic field and create a condition similar to unequal air gaps.
Loose Winding/Stator Iron:
If the stator iron is loose in the motor frame, or windings are loose in the stator slots, the rotating magnetic field from the stator will cause the loose component to move each time one of the magnetic fields passes over the loose component. These three faults are normally the cause of the vibration problems that are classified as stator electrical. The frequencies of these faults all occur at two times line frequency. On a direct drive controller, this will be 7200 CPM for 60 Hz and 6000 CPM for 50 Hz applications.
Rotor Electrical Faults:
The most common industrial motor is the AC squirrel cage induction rotor. These rotors use rotor bars as conductors to create the magnetic field on the rotor. The shape of the rotor iron or core is determined by the magnetic field.
Eccentric Rotor:
If the rotor core iron or the end rings are eccentric this will distort the rotor’s magnetic field and it will take the shape of the core. When the eccentric rotor is placed inside the concentric stator this will create unequal clearances between the rotor magnetic field and the stator magnetic field. However, since the distorted magnetic field is on the rotor, the narrow clearance will turn with the shaft. When the narrow clearance is positioned under a magnetic pole then an electrical unbalance will be created. Since the electrical unbalance changes with rotor position this fault is often referred to as dynamic eccentricity.
Broken Rotor Bars:
The purpose of the rotor bars on the squirrel cage rotor is to provide a path for current flow from one end of the rotor to the other. The current flow will create a magnetic field on the rotor. When current flows in one direction it will create a magnetic field of one polarity, either north or south. These opposing poles will be directly across from one another and will create a balanced magnetic field.
If one or more of the rotor bars are broken, current will not flow in that portion of the rotor when it is positioned under one of the magnetic fields. However, since the bars on either side of the break are connected, current will flow through these bars providing there is a complete path for current flow. This creates a dead spot on the rotor at the location of the broken bar or bars. When this dead spot is positioned under one of the magnetic fields an electrical unbalance will be created. This electrical unbalance will combine any mechanical forces acting on the rotor system and cause the total rotor forces to change.
Both broken bars and eccentric rotors are mechanical faults on the rotor, and will rotate with the rotor. In an induction motor the rotor rotates at a speed that is less than the speed of the rotating magnetic field, so the mechanical faults will move in and out from under the magnetic fields. As the rotor with the faults rotates, the electrical forces acting on the rotor will increase and decrease depending on the position of the broken bars in relation to the magnetic field. This causes the combined electrical and mechanical forces to modulate. The frequency of the modulation will be equal to the number of poles multiplied by the slip speed of the rotor. This frequency is normally referred to as Pole Pass Frequency (PPF).
Thermally Sensitive Rotor:
Some AC Induction Motor rotors’ appear that the forces coming from the rotor change with load. This usually occurs because the rotors bow as the current flows through and the rotor increases. The reason this occurs is the result of shorted core laminations, a non-uniform thickness of the rotor laminations, or casting voids in cast rotors. In any of the above cases, one side of the rotor becomes hotter than the opposing side, thus allowing hotter portion of the rotor to stretch or expand causing the rotor to bow. The bowed rotor will cause the rotor to operate eccentrically and appear as a dynamic eccentricity.
When the fault affects the rotor’s magnetic field, the unbalance forces will cause the combined rotor forces to modulate. This will cause the amplitude of the machinery vibration at rotating speed to also modulate. The FFT of an amplitude-modulated signal will cause sidebands around the fundamental frequency, which in this case is one times the running speed. The presence of the sidebands indicates that amplitude modulation is present and the spacing of the sidebands indicates the frequency of the modulation. If the fault is coming from the rotor the sidebands will be spaced at pole pass frequency. Since each of the three common rotor faults described above cause the rotor forces to modulate the FFT of each fault will appear as a spectral peak at rotating speed with PPF sidebands.
Mechanical Faults:
Other mechanical faults on the motor will appear the same as on any other machine. The fault will be identified in the FFT, based on the frequency or in some cases the pattern of the FFT. These frequencies can be obtained from any number of charts or tables.
Electrical Signature Analysis (ESA):
Electrical Signature Analysis measures all three phases of current and voltage at the motor controller, while the machine is operating. By measuring all three phases of voltage and current, a complete analysis of the power being supplied to the motor is performed each time the ESA data is taken. Additionally, an FFT is performed on the voltage and current waveform.
Testing and research has shown that many mechanical and electrical faults in the motor system will cause the motor current to modulate at the frequency of the fault.
Power Analysis:
Power analysis will not only identify problems relating to the motor, but will also identify any incoming power issues such as excessive harmonic content, voltage unbalance, voltage mismatch, current unbalance, the power factor of the motor system and the motor system efficiency. Also, since ESA simultaneously measures all three phase of voltage and current, it can very accurately determine the load on the motor. This allows the ESA software to accurately determine the actual rotor speed; typically the running speed is measured within 1 RPM.
FFT Analysis:
The FFT of the current identifies faults in the motor system similar to MVA or other signature analysis techniques. However, performing the FFT on both the motor voltage and current waveforms provides additional diagnostic capabilities, when compared to MVA and Motor Current Signature Analysis (MCSA). Both MVA and MCSA measure the response of the motor system only. If there are large spectral peaks in either the current spectrum or the vibration spectrum, which is a result of a carrier frequency in the incoming power, this is undetectable with either of these techniques. However, by performing a FFT on both the voltage and current, any spectral peaks that are present are coming from the incoming power. However, if there are no spectral peaks in the voltage spectrum that are present in the current spectrum then the fault is coming from either the motor or the driven machine.
Stator Faults:
Stator faults in ESA are categorized as either electrical or mechanical in nature.
Stator Mechanical Faults:
Faults categorized as stator mechanical faults are created when either the stator core becomes loose in the motor frame, or if the windings are loose in the stator slots. Either of these faults will cause magnetic fields created by the discontinuities in the stator iron the windings are placed to modulate. These frequencies are known as stator slot passing frequencies, which are determined by multiplying the number of stator slots by running speed.
Although not immediately catastrophic, if any looseness is allowed to continue it will result in an insulation break down of either the winding insulation, (as the looseness causes the winding insulation to wear away,) or cause the ground wall insulation to breakdown and create a ground fault. Either of these faults will eventually result in a complete winding failure, the best-case scenario being in a motor rewind or a complete destruction of the motor. If the stator iron is damaged during the failure, this failure will require a total motor replacement. The disruption of the stator slot passing frequencies are normally so slight that MVA will not pick these faults up until the fault is in a very advanced stage. These faults will cause the loose component, stator iron or winding to move, as the magnetic field rotates around the stator, which will be indicated by the line frequency sidebands surrounding the stator slot passing frequency.
Stator Electrical:
If the insulation between stator windings and ground breaks down, a winding fault or ground fault will occur. These faults result in localized heating and further insulation degradation until the winding eventually burns and completely destroys the winding and in severe cases warps or burns the inner laminar insulation.
When these faults occur, the winding’s weaknesses causes the stator slot passing frequencies to modulate at line frequency, as the magnetic field rotates around the stator. These will further modulate as the shaft turns, which will create running speed sidebands around the line frequency sidebands.
ESA can identify faults that are classified as stator electrical, but to confirm fault type, performing Motor Circuit Analysis with the motor de-energized is recommended.
Again these modulations in the stator slot passing frequency are so slight and the forces created are very small and are usually undetectable with MVA.
Rotor Faults:
Common rotor faults detected using ESA are Static Eccentricity (unequal air gaps), Dynamic Eccentricity (Eccentric Rotor), and broken rotor bars.
Static Eccentricity:
When the rotor core is concentric and centered in the magnetic field, the current flowing through the rotor bars will be equal and polar opposites on opposing sides of the rotor. But, if the rotor is not centered in the magnetic field then the strength of the magnetic field in the rotor bars that are closest to the stator will be stronger than the opposite side. Additionally, as the magnetic poles rotate around the stator, it will cause the magnetic field, around the rotor bars, to modulate each time one of the poles passes the narrow clearance. This will create two times the line frequency spectral peaks, around the rotor bar’s passing frequency. The rotor bar passing frequency is equal to number of rotor bars times the running speed.
Dynamic Eccentricity:
If the rotor is centered, but the rotor core is eccentric this will create a narrow air gap that rotates around, the inside of the air gap with the rotor. The narrow air gap creates two times line frequency (2xLF) sidebands around rotor bar passing frequency, but because the narrow clearance is rotating around in the air gap, at rotor speed, it will cause the 2xLF sidebands to modulate at rotor speed. This creates running speed sidebands around the 2xLF sidebands.
Broken Rotor Bars:
When the dead spot on the rotor passes under a magnetic field there will be no inductance between the stator’s magnetic field and the rotor. This will cause the motor current to modulate at PPF, this creates PPF frequency sidebands around line frequency in the current spectrum.
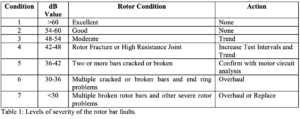
Research has proven that the severity of the rotor bar fault is based on the relationship of the modulation; seven levels of severity have been identified, see table 1.
Mechanical Faults:
Any mechanical faults that will create vibrations on rotating equipment acts like a load on the motor. Even a very small impact response, such as the bearing system’s natural frequencies, is easily detected using ESA. In the ESA spectrum mechanical faults appear as center frequencies of the line frequency sidebands.
Demod Spectrum:
ESA also generates a demod low frequency spectrum, Fmax 120 Hz. The demod spectrum is a signal processing technique that strips the line frequency signal from the captured time waveform signal. All that remains in the processed signal are frequencies that are causing the motor current to modulate. The FFT of this process signal, very clearly displays all the frequencies of faults, such as faults coming from the rotor including unbalance, misalignment, (not only on the motor but in many cases on the driven machine as well). PPF and running speed (RS) peaks which normally appear as side bands around line frequency in the normal current spectrum appear as a single peaks in the demod spectrum. This helps the software very accurately determine the actual RS of the motor system at the time the data was taken, usually within 1 RPM accuracy. Other fault frequencies which are less than 120 Hz will appear as single peaks in the demod spectrum and belt defects are very easily detected using the demod spectrum.
Other Mechanical Faults:
Gear mesh issues, vane passing and any other mechanical force that is present anywhere in the motor system will appear in the high frequency current spectrum as center frequencies between line frequency side bands.
Rolling Element Bearing Defects:
Early to late stage 2 bearing defects appear very clearly in the high frequency current spectrum as line frequency side bands surrounding a non-integer multiple of running speed.
What is the future of ESA?
Preliminary testing has indicated that ESA is one of the most powerful tools available for screening motor driven machines. In almost all cases the faults appear much earlier in the ESA data than in MVA since the force of the fault does not have to be sufficient to move the entire machinery structure, as does mechanical vibration. Also, ESA is capable of determining the condition of the power supplied to the motor system as well as determine the motor efficiency, and most importantly the exact running speed of the motor at the time the data was taken. This measurement is critical when using ESA and MVA, since most faults in the motor system are speed dependent and an accurate determination of the running speed is crucial to accurate spectrum analysis.
Frequency response:
Since ESA uses changes in motor current as identifiers of faults, even very low and very high frequency faults can be detected. MVA has limits based upon the measurement type (relative or absolute) and the frequency response of the sensor.
Deep Well Vertical Pumps:
Experience with vertical pumps has shown that faults in the pump are not transmitted to the motor. To determine what is going on in the pump it is necessary to place transducers on the pump itself. Pump faults are not detected on the motor until the pump is usually completely destroyed. Preliminary testing has shown that small amounts of cavitation and even vane passing frequencies in the pump can be easily detected using ESA. MVA spectrum taken at the same time showed no evidence of either fault.
Variable Frequency Drives:
When using ESA to test motors driven by VFDs, not only can motor system faults be detected, but aged capacitors and other electrical problems in the drive are very readily apparent.
For more information about Electrical Signature Analysis or how to improve motor system reliability at your plant go to www.alltestpro.com or email [email protected].
ATPOL III™
Comprehensively analyze power quality and electrical motor component integrity on AC/DC motors, generators, and transformers.

AT34 Hybrid Seminar — 7/20/2026
PLEASE CONTACT [email protected] AND MENTION REF#125-13888 FOR MORE INFORMATION.

Virtual Orientation — 7/17/2026
1:00pm-2:00pm EST PLEASE CONTACT [email protected] AND MENTION CASE #125-13889 FOR MORE INFORMATION. First Name * E-mail * Company Phone* Product of Interest* —Please choose an option—AT34EV™AT34™AT7™AT7™ PROFESSIONALATPOL III™MDIII™ALL-SAFE PRO®AccessoriesSoftwareTechnical Support [...]